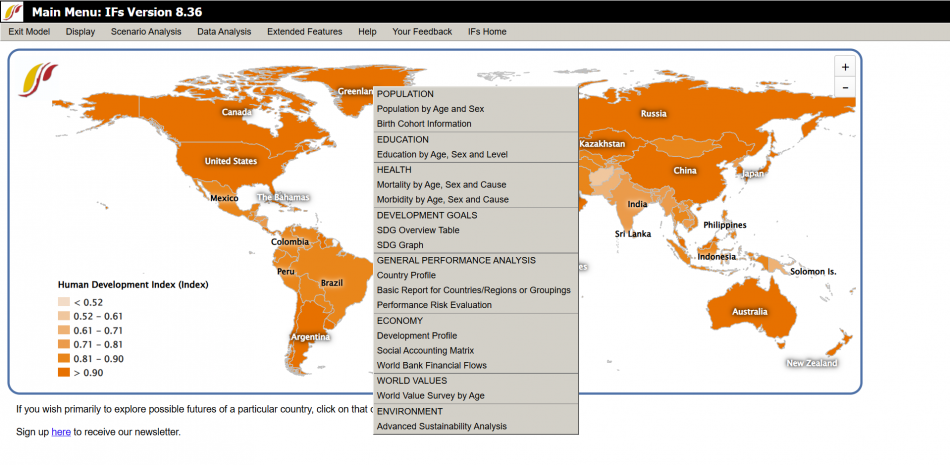
Main Menu Map Pop-up
The Main Menu Map is the first thing that appears after starting and loading IFs. It shows a world map with easy access to a range of information related to the countries covered by IFs. The map is color coded to show how different countries compare to each other in a chosen variables (which is the Human Development Index by default). Once another variable is explored in one of the other display options in IFs, this most recently explored variable will then be shown when returning to the Main Menu Map. The left hand corner of the map has a legend which shows the current variable being displayed and its color coding. Zoom in or out in the map by clicking on the plus or minus signs at the right of map.
Click on a country to open a pop-up menu with options to explore country specific information and displays. The options on the pop menu include:
POPULATION
Population by Age and Sex: Open the Population by Age and Sex specialized display for the chosen country.
Birth Cohort Information: Open the Birth Cohort Information specialized display for the chosen country.
EDUCATION
Education by Age, Sex, and Level: Open the Education by Age, Sex, and Level specialized display for the chosen country.
HEALTH
Mortality by Age, Sex, and Cause: Open the Mortality by Age, Sex, and Cause specialized display for the chosen country.
Morbidity by Age, Sex, and Cause: Open the Morbidity by Age, Sex, and Cause specialized display for the chosen country.
DEVELOPMENT GOALS
SDG Overview Table: Open the SDG Overview Table specialized display for the chosen country.
SDG Graph: Open the SDG Graph specialized display for the chosen country.
GENERAL PERFORMANCE ANALYSIS
Country Profile: Display a map of the selected country and a list of current and forecasted values for a set of key variables. This is an option unique to the Main Menu Map.
Basic Report for Countries/Regions or Groupings: Open the Basic Report for Countries/Regions or Groupings display for the chosen country.
Performance Risk Evaluation: Open the Performance Risk Evaluation specialized display for the chosen country.
ECONOMY
Development Profile: Open the Development Profile specialized display for the chosen country.
Social Accounting Matrix: Open the Social Accounting Matrix specialized display for the chosen country.
World Bank Financial Flows: Open the World Bank Financial Flows specialized display for the chosen country.
WORLD VALUES
World Value Survey by Age: Open the World Value Survey by Age specialized display for the chosen country.
ENVIRONMENT
Advanced Sustainability Analysis: Open the Advanced Sustainability Analysis specialized display for the chosen country.
