Geographically-Fixed Displays: Difference between revisions
CamrynDreyer (talk | contribs) No edit summary |
No edit summary |
||
| (4 intermediate revisions by 2 users not shown) | |||
| Line 3: | Line 3: | ||
Geographically-fixed Displays are found as a sub-option under Display on the Main Menu. | Geographically-fixed Displays are found as a sub-option under Display on the Main Menu. | ||
[[File: | [[File:Useifs6.PNG|frame|right]] | ||
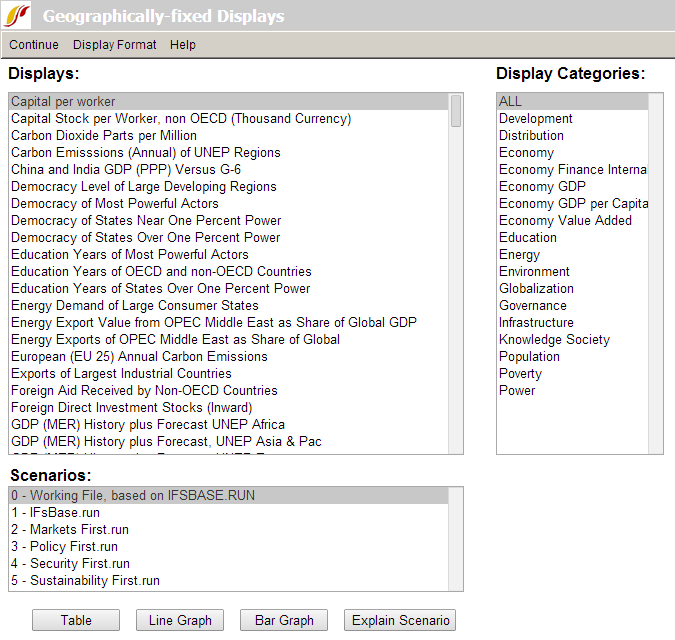
Geographically-fixed Displays are grouped into categories found on the right side of this screen. Clicking on any one of these categories will produce a list of displays on the left that relate to the selected category. By default the ALL category is selected, so the Displays box to the left contains all available pre-constructed displays. | Geographically-fixed Displays are grouped into categories found on the right side of this screen. Clicking on any one of these categories will produce a list of displays on the left that relate to the selected category. By default the ALL category is selected, so the Displays box to the left contains all available pre-constructed displays. | ||
Latest revision as of 21:22, 1 August 2018
This display feature of IFs allows users to quickly display previously designated sets of forecasts for various countries or groups. It is more limited than Flexible Displays since it does not allow users to modify the countries, regions, or geographic-lists displayed. However, the limited set of options makes it relatively straightforward for new users to get a feel for what the IFs system can do and how it displays its forecasts. Moreover, the geographically-fixed form is useful for (1) displays that are called upon often and that have fixed geographical elements (for instance, for the world as a whole) and (2) displays that combine countries and country groupings in ways that are difficult to produce within the flexible display form. If you need to analyze a particular set of variables for different countries than those designated by Geographically-fixed Displays, you will need to open the Flexible or Self-Managed Displays form and specify the countries and variables desired.
Geographically-fixed Displays are found as a sub-option under Display on the Main Menu.
Geographically-fixed Displays are grouped into categories found on the right side of this screen. Clicking on any one of these categories will produce a list of displays on the left that relate to the selected category. By default the ALL category is selected, so the Displays box to the left contains all available pre-constructed displays.
Once a display is selected, variables from it can then be graphed for one or more scenario files of IFs. These scenario files are located right beneath the Displays box. In order to select more than one scenario file, simply click on one you would like to select, hold the Ctrl button, and click on the rest of the Scenario Files you would like to choose. Different Scenario Files are based on alternative parameter values. To see parameter values underlying alternative scenarios in the Scenario list, highlight one of them and click on the Explain Scenario button.
Alongside the Explain Scenario button, there are three options for displaying your results located at the bottom of the screen. You can choose to display results as tables, line graphs or bar graphs.
The Display Format option at the top of the Geographically-fixed Displays menu allows users to change the title of their results, alter the year, or the display interval. Choosing the Currency sub-option presents users with a new window where users can flag certain currencies of interest or learn more about currencies used in different countries/regions. Clicking on the Horizon sub-option, you can choose to alter the Time/Run Horizon. This allows you to tailor your graphs and tables to your needs. The Use Estimation to Complete Data sub-option uses processes of interpolation (hole-filling) and extrapolation (extension of series backward or forward) to produce a mixed data/estimated series for all historical years. The final Display Format sub-option is named "Use all available Historical data." It controls what happens in a tabular or graphical display for years in which there are both historical data and forecast values. For instance, when the Base Year is 2010, there might be both data and forecasts from the model for 2010 and 2011. In the default situation, the display will show forecast values for all forecast years and display the data values only through 2009. But if this sub-option is selected, all data values are used and over-ride the forecasted ones as available; with this option, historical values in tables are shown in blue so that it is possible to tell which values from 2010 forward are from data and which are from forecasts.
