Flexible Displays
The Flexible Displays can be found under Display on the Main Menu.
This display feature of IFs gives users more flexibility than the Geographically-Fixed Displays by allowing for the display of forecasts (sometimes with historical data) by specific country or group. Flexible Displays allows a user to select displays that contain a wide variety of forecasted variables (sometimes in combination with historical data series), create graphs and view tables of these displays both singly or in combination with others, and even do analysis using comparison and relationship options in the menus. Not all of the variables available in IFs can be found in Flexible Displays, as its purpose is to provide users with an access to commonly-used variables for forecasting. If you wish to access the full range of variables and parameters, you can do so in Self-Managed Displays.
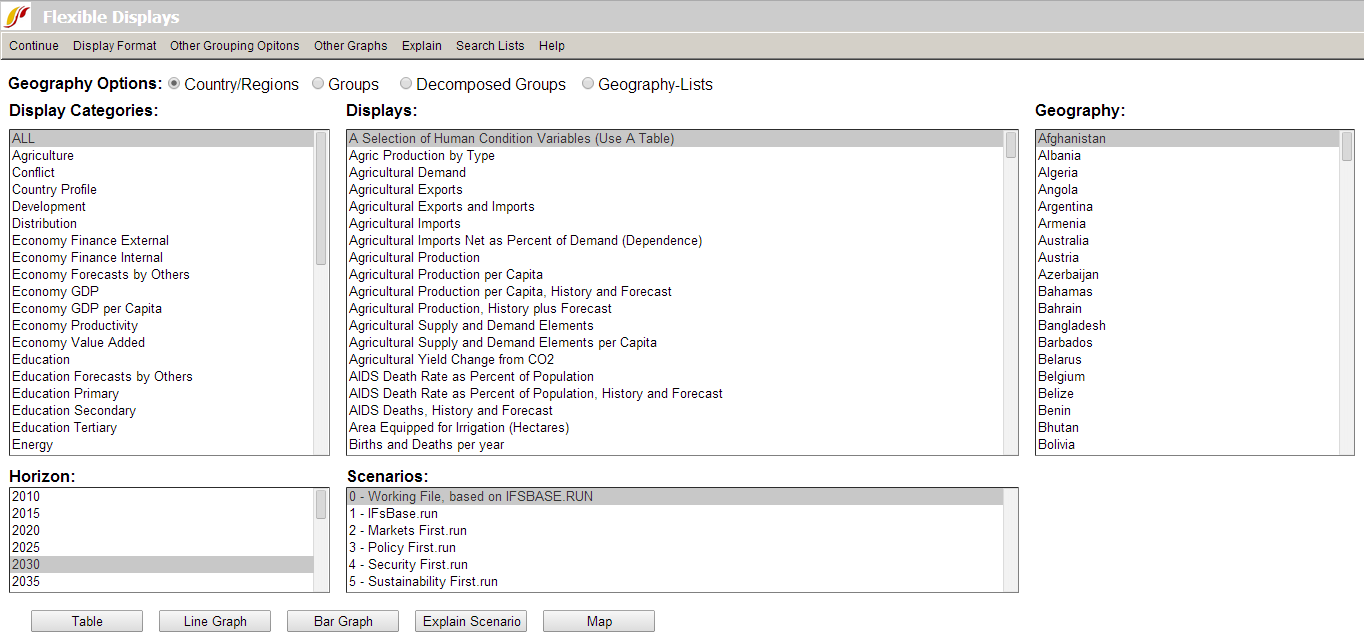
The general list of categories is located in a box on the left hand side of the screen. To the right of this list is a list of displays . Each display belongs to one of the broader categories. Initially, ALL is highlighted so Displays will contain every option included in the Flexible Displays, ordered alphabetically from A Selection of Human Condition Variables (Use A Table) to Youth Bulge, Percent of Adult Pop Between 15 and 29. If you are interested in one specific category, click on it and the general list of displays will be reduced to only those that pertain to the category you have selected.
To the right of the list of variables is a list of every country. By default, the 186 countries captured in IFs are available for selection. However, the Geography Options radio buttons located directly beneath the top menu bar allow users to select alternate geographic representations such as groups, decomposed groups, or geography-lists. Once an option other than Country/Regions is selected, the Geography box will change its contents accordingly.
Two smaller boxes, located at the bottom of the screen, control additional dimensions for organizing displays. Horizon specifies the year to which forecasts extend. And the Scenarios list box contains the IFs Base Case, IFs Working File and other scenario files that were already pre-loaded in the online version of the model. If you would like to learn more about what specific parameters and variables are affected by these Scenario Files, simply highlight one and click on the Explain Scenario button at the bottom of the page.
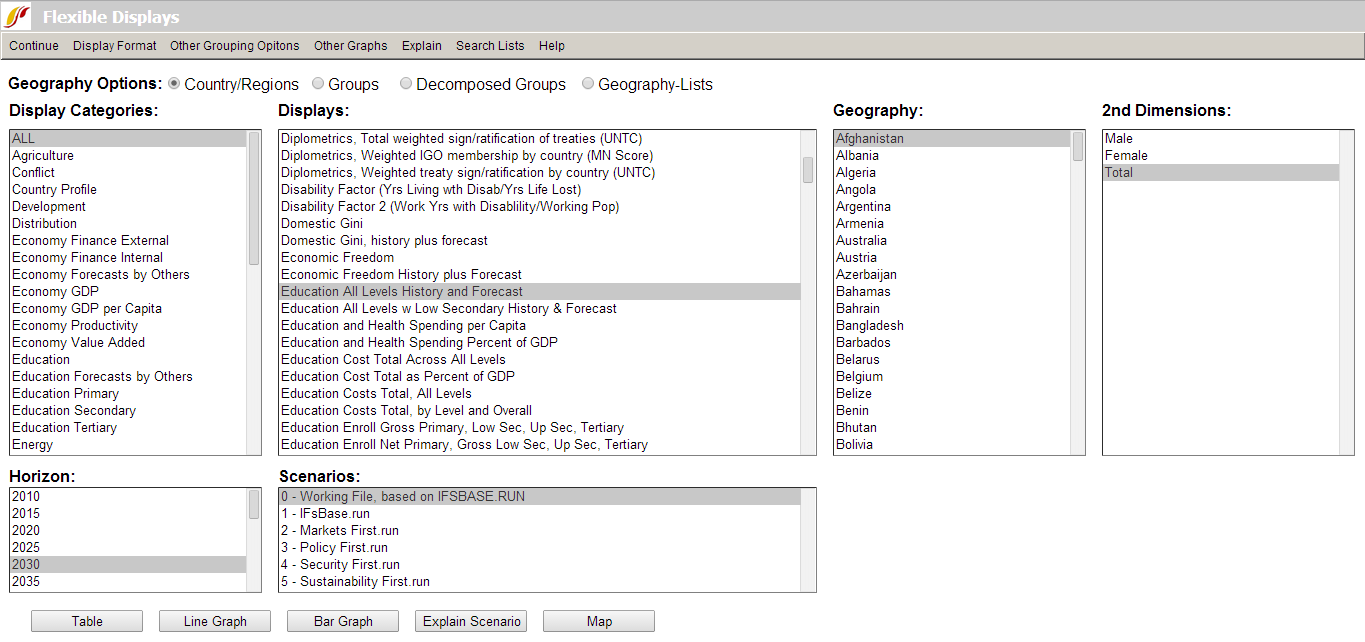
Certain displays, such as education, when selected, will cause other windows to appear that display different dimensions, or ways of disaggregating the data. For example, selecting the display Education All Levels History and Forecast brings up the 2nd Dimensions as shown below, in this case gender, from which the user is able to choose.
The user is also able simultaneously to select more than one country, variable, category, dimension, or Scenario File for tables or graphics by simply clicking on one item in any of the boxes displayed, holding down the control button (Ctrl) and clicking on another one in the same box. Horizon is the only field that does not allow multiple selections. This function is particularly useful for comparison analysis, whether the user is comparing results for different variables, different scenarios, different countries, or some combination of the three.
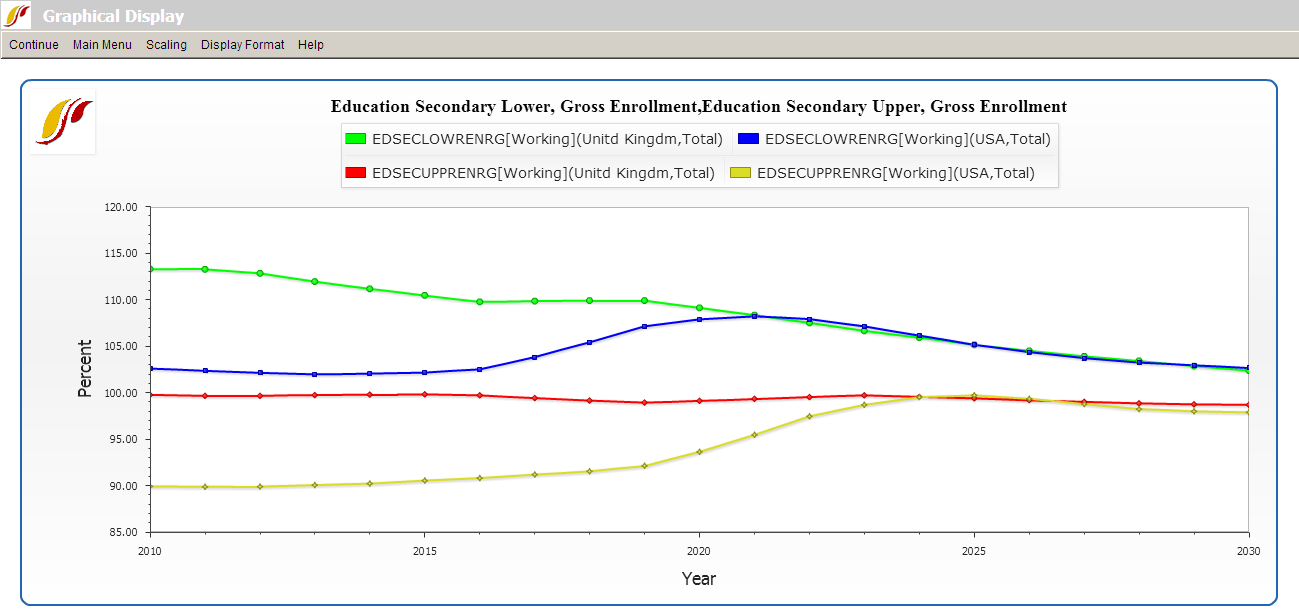
For example, a user might want to analyze lower secondary and upper secondary education gross enrollment rates for both the US and the UK, in which case, he/she would click on the Education Secondary category, select Education Secondary Lower, Gross Enrollment in the Display list, hold the control button, select Education Secondary Upper, Gross Enrollment and then select both countries under the Geography list. Total (male and female combined), the year 2030, and the Working File (identical to the Base Case if a user hasn't run any scenario files) are the default selections for the rest of the fields. Click Line Graph to create the graph displayed below.
IFs is in the process of adding the results of forecasts done by other academic or international organizations such as population forecasts done by the UNPD, education forecasts done by IIASA, and a growing number of others. These forecasts can be found as their own variables under the Forecasts by Others category. They are also categorized by sub-modules of IFs, such as Economy Forecasts by Others and Energy Forecasts by Others. This new feature gives users the ability to quickly and easily compare the forecasts of other experts with those of IFs. To graph or tabulate such comparison forecasts, go to the Display Categories list, hold the control button, click on Forecasts by Others and any relevant IFs categories you wish to compare. The Displays list will then contain a list of all the variables in all selected categories.
When the user has chosen a desired series, geographic representation, time horizon as well as a scenario to display, he/she should then click on any display button from the bottom of the form. Options include: Table, Line Graph, Bar Graph and Map. The user is also able to display pie charts, radial graphs or scatter plots, located under the Other Graphs heading in the Flexible Displays menu.
Additionally, choosing the Display Format option located on the top menu bar allows the user to more professionally tailor the graphs as needed. Firstly, the user can change the titles for tables and graphs, and the titles of the x- and y-axes for graphs. The user can also edit the table display interval, as well as edit the year for a pie chart, scatter plot, or map. Secondly, the user is able to select the currency in which to display data that is otherwise displayed in US dollars. Thirdly, the user can set the limits of the run horizon with a maximum horizon of 2100.
In addition under Display Format is a set of sub-options that are relevant to all displays that combine historical data and forecasted values (and which typically have "History and Forecast" in the name of the Display). These options control the manner in which historical data, which is seldom available for all years, are displayed. The "Use estimation to complete data" sub-option uses processes of interpolation (hole-filling) and extrapolation (extension of series backward or forward) to produce a mixed data/estimated series for all historical years. The sub-option labeled "Use estimation to complete data (only holes no extrapolation)" only uses interpolation, because extrapolation can sometimes give very poor results, especially over a very long time period without actual data values.
The final Display Format sub-option is named "Use all available Historical data" and is not related to completing historical data. Instead it controls what happens in a tabular or graphical display for years in which there are both historical data and forecast values. For instance, when the Base Year is 2010, there might be both data and forecasts from the model for 2010 and 2011. In the default situation, the display will show forecast values for all forecast years and display the data values only through 2009. But if this sub-option is selected, all data values are used and over-ride the forecasted ones as available; with this option, historical values in tables are shown in blue so that it is possible to tell which values from 2010 forward are from data and which are from forecasts.
The Explain menu in the heading is an option that, when selected, will provide a definition, show the historic formula, and list any dimensions available for any selected variable – see the image displayed below.
Clicking on the Search Lists option in the heading allows the user to search for any variable in the IFs database, and add that variable to the Displays box in the Flexible Displays main menu by clicking on the Load button.


