Education by Age, Sex, and Level: Difference between revisions
No edit summary |
No edit summary |
||
| (4 intermediate revisions by 3 users not shown) | |||
| Line 1: | Line 1: | ||
To access the Education by Age, Sex, and Level option, select Display from the Main Menu, then select sub-option Specialized Displays by Issues and then Education by Age, Sex, and Level. Education by Age, Sex, and Level is also accessible through the [ | To access the Education by Age, Sex, and Level option, select Display from the Main Menu, then select sub-option Specialized Displays by Issues and then Education by Age, Sex, and Level. Education by Age, Sex, and Level is also accessible through the [[Main_Menu_Map_Pop-up|Main Menu Map Pop-up]] options. | ||
Education by Age, Sex, and Level displays are broken down into levels of educational attainment with each level of attainment being distinguished by a different color. Educational attainment is broken down as follows: no formal education, primary education, secondary education, tertiary education and those too young to achieve formal education. Check with the legend at the top of the graph to see what colors represent what level of educational attainment. | Education by Age, Sex, and Level displays are broken down into levels of educational attainment with each level of attainment being distinguished by a different color. Educational attainment is broken down as follows: no formal education, primary education, secondary education, tertiary education and those too young to achieve formal education. Check with the legend at the top of the graph to see what colors represent what level of educational attainment. | ||
| Line 7: | Line 7: | ||
You are also able to display information as a product of the base case or of a working file. Click on the Change Display option from the toolbar, then the Change Scenario sub-option. You then have the choice of the base case or a working file. | You are also able to display information as a product of the base case or of a working file. Click on the Change Display option from the toolbar, then the Change Scenario sub-option. You then have the choice of the base case or a working file. | ||
The chart below is the projected educational attainment by cohort and sex of Tanzania for the year 2010. Remember, in order to display [ | The chart below is the projected educational attainment by cohort and sex of Tanzania for the year 2010. Remember, in order to display [[Repeated_Features#Country/Region,_Group_or_Geography-List|groups instead of countries/regions]], you have to toggle between the Groups and the Countries/Regions buttons. | ||
[[File:Projected educational attainment by cohort and sex of Tanzania.png|center|thumb|Projected educational attainment by cohort and sex of Tanzania]] | |||
= <span style="font-size:xx-large;">Cost of Education Goals</span> = | = <span style="font-size:xx-large;">Cost of Education Goals</span> = | ||
| Line 15: | Line 14: | ||
This Specialized Display feature can be reached from the Display option on the main menu of IFs, followed by Specialized Displays for Issues, and then Cost of Education Goals. | This Specialized Display feature can be reached from the Display option on the main menu of IFs, followed by Specialized Displays for Issues, and then Cost of Education Goals. | ||
[[File:Useifs16.PNG|frame|right|Scale-up Cost Display Window]] | |||
From here, users can identify the costs of achieving selected educational attainment goals for different units of countries or groups. On the left hand side of the display, users can select a country to examine. Change this list to a list of groups, g-lists or decomposed groups by toggling the Group Options at the top of this menu. After selecting a country, choose one of the Scenarios that are pre-loaded into IFs. | From here, users can identify the costs of achieving selected educational attainment goals for different units of countries or groups. On the left hand side of the display, users can select a country to examine. Change this list to a list of groups, g-lists or decomposed groups by toggling the Group Options at the top of this menu. After selecting a country, choose one of the Scenarios that are pre-loaded into IFs. | ||
Latest revision as of 19:28, 19 March 2025
To access the Education by Age, Sex, and Level option, select Display from the Main Menu, then select sub-option Specialized Displays by Issues and then Education by Age, Sex, and Level. Education by Age, Sex, and Level is also accessible through the Main Menu Map Pop-up options.
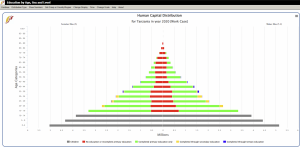
Education by Age, Sex, and Level displays are broken down into levels of educational attainment with each level of attainment being distinguished by a different color. Educational attainment is broken down as follows: no formal education, primary education, secondary education, tertiary education and those too young to achieve formal education. Check with the legend at the top of the graph to see what colors represent what level of educational attainment.
These graphs can be projected through time using the Advance and Regress features under the Time menu option located above the chart. Additionally, you can switch from country/region to group by using the toggle on the top menu bar. Using the Distribution Type option at the top of this screen you can select only those who did not attain any formal education, those who attained primary or more, those with secondary or more, or those with tertiary levels of educational attainment.
You are also able to display information as a product of the base case or of a working file. Click on the Change Display option from the toolbar, then the Change Scenario sub-option. You then have the choice of the base case or a working file.
The chart below is the projected educational attainment by cohort and sex of Tanzania for the year 2010. Remember, in order to display groups instead of countries/regions, you have to toggle between the Groups and the Countries/Regions buttons.
Cost of Education Goals
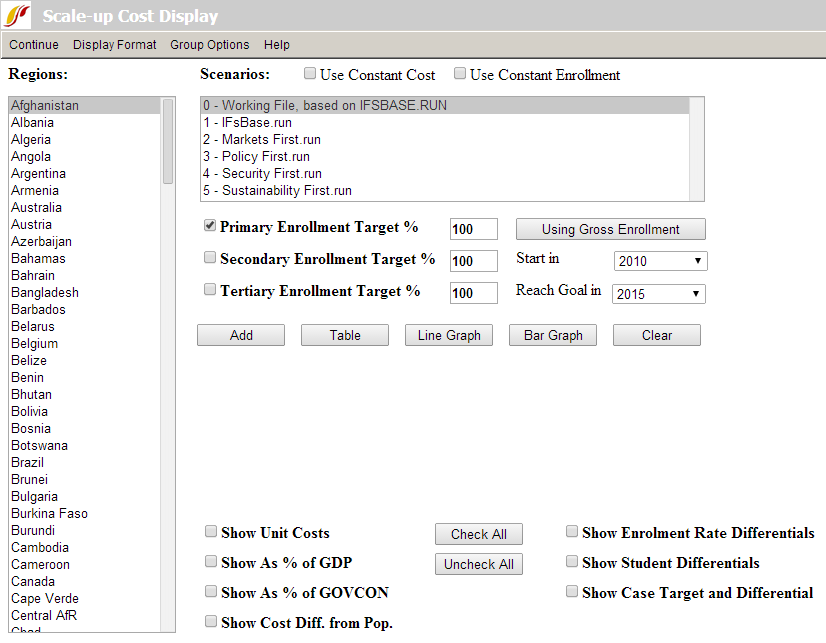
This Specialized Display feature can be reached from the Display option on the main menu of IFs, followed by Specialized Displays for Issues, and then Cost of Education Goals.
From here, users can identify the costs of achieving selected educational attainment goals for different units of countries or groups. On the left hand side of the display, users can select a country to examine. Change this list to a list of groups, g-lists or decomposed groups by toggling the Group Options at the top of this menu. After selecting a country, choose one of the Scenarios that are pre-loaded into IFs.
After choosing a country or group as well as a run-file, next select your educational attainment goals. This can be accomplished by deciding what percentage of total enrollment you would like to highlight, as well as in what year you would like to start and what year you would like to end.
Then, select the results that you would like to see. Click any of the boxes at the bottom of this display option and these variables will be loaded into the variable display box. Finally, choose your output: either a table, line graph or bar graph to visualize your results.

