Use IFs (Download): Economy: Difference between revisions
(Created page with "= <span style="font-size:xx-large;">Development Profile</span><span style="font-size:xx-large;"></span> = The Development Profile display can be reached from the Display opti...") |
(Moved World Bank section above inactive sections and reformatted the table to the correct display.) |
||
| (33 intermediate revisions by 4 users not shown) | |||
| Line 1: | Line 1: | ||
= <span style="font-size:xx-large;">Development Profile | = <span style="font-size:xx-large;">Development Profile</span> = | ||
The Development Profile display can be reached from the Display option of the Main Menu, Specialized Display sub-option and Development Profile sub-sub-option. It is also located under the [ | The '''''Development Profile''''' display can be reached from the Display option of the Main Menu, Specialized Display sub-option and Development Profile sub-sub-option. It is also located under the [[Main_Menu_Map|Main Menu Map]] options. | ||
The purpose of the Development Profile display feature is to track how Human Capital, Social Capital, Physical Capital and Knowledge contribute to the annual growth of a country/region or a group. For purposes of development, it is helpful to understand what aspects of a country/region or group are helping or harming the growth of a country/region or group. | The purpose of the '''''Development Profile''''' display feature is to track how Human Capital, Social Capital, Physical Capital and Knowledge contribute to the annual growth of a country/region or a group. For purposes of development, it is helpful to understand what aspects of a country/region or group are helping or harming the growth of a country/region or group. | ||
There are three dropdown menus at the top of the screen. Use the first toggle in the top-left corner to switch between regions or global groups (depending on the selection made in the Main Menu). To the right of the country/region or group scroll-down list, choose a year to display. Finally, use the third menu below to select the appropriate Scenario Run File. | |||
[[File:Development profile screen.png|center|thumb|889x889px|Development Profile screen]] | |||
The menu bar at the top of the screen includes the following tools: | |||
* [[Repeated Features#General%20Display%20Options|'''Continue''']]''':''' Go back to the previous menu or to the Main Menu of IFs. | |||
* '''Using Country/Regions:''' Switch | |||
Select | * '''Compare Country/Regions:''' Select "Show" to display dropdown menus at the top of the screen: Select File is a selection of the scenario run for comparison, and Compare Groups or Countries specify options for selecting a comparison region or country. Select "Hide" to remove the comparison view and restore the display to a single country. | ||
* '''Help:''' Go to the corresponding page in the [[Main Page|Pardee Wiki]] for the current feature or display. | |||
The left column of the table represents different variables calculated by IFs organized into categories. The Computed Value column includes the actual numbers calculated for the selected year (top right scroll-down list). These values are then used to calculate the Expected Value Predicted from GDP (Gross Domestic Product) Per Capita at PPP (Purchasing Power Parity). A Standard Error is then displayed, followed by a Standard Error of the Value from the Prediction. The final two values display how the categories Contributed to Annual Growth (as a percentage) and how their contribution can be displayed as a parameter. | |||
[[File: | Click any variable displayed on the left to graph the Computed Value of that variable for the selected year, as well as a logarithmic graph of GDP at PPP compared to the variable. See an example below: | ||
[[File:Display function.png|center|thumb|900x900px|Display Functions screen]] | |||
To see forecast over time for the selected variable, click on the number displayed in the Computed Value column. For more information on how to use the available table tools, see the [[General Display Options|Table Use]] page. | |||
To visually represent the data, use a [[General_Display_Options#Line_Graph,_Bar_Graph,_Scatter,_Etc.|line graph or a bar graph]], save the information, toggle between whole number representation or representation as a percentage of the base year, toggle between displaying results as cumulative totals, turn the interval average on or off, add or design a filter or set the time horizon for your information. | |||
= <span style="font-size:xx-large;">Social Accounting Matrix</span> = | |||
The '''''Social Accounting Matrix''''' sub-sub-option can be reached from the Display option on the Main Menu, the Specialized Display sub-option and then the Social Accounting Matrix sub-sub-option. It is also located under the [[Main_Menu_Map|Main Menu Map]] options. | |||
A '''''Social Accounting Matrix (SAM)''''' is an extension of an input-output table that economists use to show the inter-sectoral flows of goods and services within an economy (see the upper left-hand cell of the SAM). The SAM more generally displays flows among actor-classes in the socio-economic system. For instance, the cell in the government column and household row shows flows from the government to households (such as pension payments). The cell in the firms' column and government row similarly shows flows from firms to the government (such as tax payments). Double-click on certain numbers within the SAM table and this will open up a small window with options to Expand Cell, Show Over time, Explain Cell Content or Cancel the operations. When expanded, the SAM shows additional sectors and categories such as FDI outflows, worker remittances, aid donations, and debt repayments. | |||
Move across [[Country/Region,_Group_or_G-List|countries/regions or groupings]] and across years with the drop-down boxes at the top of the screen.[[File:SAM.png|center|frame|Example of a Social Accounting Matrix page, Flows]] | |||
There are several features and options that can be accessed using the menu bar at the top of the screen. These include: | |||
* [[Repeated Features#General%20Display%20Options|'''Continue''']]''':''' Go back to the previous menu or to the Main Menu of IFs. | |||
* '''Switch:''' Modify the display settings of the SAM with the following options: | |||
** '''Use Groups:''' Click to switch the display from individual countries/regions to predefined groups. Click again (the menu will now say Use Country/Regions) to switch back to viewing countries/regions individually. | |||
** '''Percent Change From Base Case:''' This option toggles the display to show the percent change from the Base Case (Current Path) instead of absolute values. It helps to quickly identify relative differences between the selected run and the Base Case. | |||
** '''Show Stocks or Switch to Show Flows:''' This option toggles between showing stocks (e.g., accumulated levels) and flows (e.g., yearly transactions) within the SAM. | |||
** '''Expand SAM:''' Expand the SAM table to display a more detailed view of flows between sectors, households, firms, capital accounts, government sectors, and the rest of the world (ROW). Additional categories such as FDI outflows, worker remittances, aid donations, and debt repayments are included in the expanded view. | |||
* '''Help:''' Go to the corresponding page in the [[Main Page|Pardee Wiki]] for the current feature or display. | |||
* '''About:''' Click to display short description of the feature being used. | |||
''Note: When toggling between stocks and flows, users may note that some of the stocks are not present. This is because this feature of IFs is currently under development.'' | ''Note: When toggling between stocks and flows, users may note that some of the stocks are not present. This is because this feature of IFs is currently under development.'' | ||
< | = <big>Growth Accounting</big> = | ||
The '''''Growth Accounting''''' sub-option can be reached from the Display option on the Main Menu, the Specialized Display sub-option, and then the Growth Accounting sub-option. It is also located under the [[Main Menu Map]] options. | |||
This display provides historical and forecasted data on the sources of economic growth, decomposing GDP growth into contributions from factors such as capital accumulation, labor force growth, multifactor productivity (MFP), capacity utilization, and climate impacts. Analyze these contributions across different countries, sectors, and scenarios. | |||
Use the drop-down boxes at the top of the screen to select different Regions (countries), Economic Sectors, Scenarios, and Variables. | |||
[[File:Growth Acc.png|center|thumb|900x900px|Example of Growth Accounting Page]] | |||
There are several features and options that can be accessed using the menu bar at the top of the screen. These options include: | |||
* [[Repeated Features#General%20Display%20Options|'''Continue''']]''':''' Go back to the previous menu or to the Main Menu of IFs. | |||
* '''Print:''' Print the current display or export it to a printable format. | |||
* '''Display Format:''' Modify how the data is displayed: | |||
** '''Change to Bar Chart:''' Display the selected variables in a bar chart format. | |||
** '''Change to Line Graph:''' Display the selected variables in a line graph format. | |||
** '''Set Title, Display Interval, or Year:''' Modify of the title, time interval, year labeling, and X/Y axis for graphs. | |||
** '''Display/Run Horizon:''' Adjust the horizon for the data display. | |||
** '''Annual Growth Rate:''' Pull up annualized growth rates. When unselected, it presents full interval growth rates. | |||
** '''Adjustment to Actual Growth:''' Adjust modeled outputs to better align with historical actual growth data. | |||
** '''Decompose MFP:''' Break down multifactor productivity into its detailed components. | |||
* '''Grouping Options:''' Select between viewing [[Index.php?title=Country/Region, Group or G-List&action=edit&redlink=1|Country/Regions, Groups or G-lists]]. | |||
** '''Using Countries/Regions:''' Display individual countries or regions. | |||
** '''Using Groups:''' Display groups. | |||
** '''Using Decomposed Groups:''' Select a group but display data separately for each country within the selected group. | |||
** '''Using G-Lists:''' Customized group lists for analysis. | |||
* '''Label Options:''' Adjust labeling settings for graphs or tables to customize the appearance of outputs. | |||
** '''Use First Dimension Only:''' Label based on the first selected dimension. | |||
** '''Use Sector Only:''' Display only the sector names. | |||
** '''Use Scenario Names Only:''' Display only the scenario names. | |||
** '''Use Components Only:''' Display only component names. | |||
** '''Use Alias for Group Names:''' Replace group names with user-defined aliases. | |||
** '''Reset Labels:''' Return all labels to default settings. | |||
* '''Go to Development Profile:''' Go directly to a country or region’s detailed Development Profile. | |||
* '''Explanatory Note:''' View a brief description of the Growth Accounting display and its underlying methodology. | |||
* '''Help:''' Go to the corresponding in the [[Main Page|Pardee Wiki]] for the current feature or display. | |||
The Variables available in the '''''Growth Accounting''''' display include: | |||
* '''Capital:''' Contribution of physical capital accumulation to GDP growth. | |||
* '''Labor:''' Contribution of labor force growth to GDP growth. | |||
* '''Multifactor Productivity (MFP):''' Contribution of improvements in efficiency and technology to GDP growth. MFP is further disaggregated into several components (see below). | |||
* '''Capacity Use:''' Impact of variations in the utilization rate of available capital and labor. | |||
* '''Climate Impact:''' Effect of climate change on productive capacity. | |||
* '''GDP Growth (for comparison):''' Overall GDP growth rate combining all components. | |||
* '''Technology Base MFP:''' Impact of advancements in technological infrastructure and innovation. | |||
* '''Knowledge MFP:''' Effect of accumulated knowledge and research on productivity. | |||
* '''Human Capital MFP:''' Contribution of improvements in education, skills, and workforce capabilities. | |||
* '''Social Capital MFP:''' Impact of societal institutions, trust, and networks on economic productivity. | |||
* '''Physical Capital MFP:''' Productivity gains linked to better utilization or quality of physical assets. | |||
* '''Correction MFP:''' Adjustments made to account for modeling or measurement inconsistencies. | |||
After making selections, choose to '''Graph''' the results, view them in a '''Table''', or '''Clear''' the selections to start over by clicking one of these options at the bottom of the page. | |||
[[File:Gr Acc graph.png|center|thumb|900x900px|Example of Growth Accounting Graph for Kenya]] | |||
For example, the graph above shows the contribution of labor to agricultural growth in Kenya under the IFsBase scenario. The x-axis represents years from 2020 to 2100, while the y-axis displays the growth rate contribution of the labor factor. For more information on how to use the available table tools, see the [[General Display Options|Table Use]] page. | |||
= <span style="font-size: xx-large;">World Bank Financial Flows</span> = | |||
The '''''World Bank Financial Flows''''' sub-sub-option can be reached from the Display option on the Main Menu, the Specialized Display sub-option and then the World Bank Financial Flows sub-sub-option. It is also located under the [[Main Menu Map]] options. | |||
This display provides historical and forecasted data on loans, repayments, and sectoral financial interactions between countries and the World Bank. Click on any variable name to open a table displaying the values for that variable over time and different scenarios. From the table menu options, create a graph, map the data, save it, or adjust display settings. For more information on how to use the available table tools, see the [[General Display Options|Table Use]] page. | |||
[[File: | Use the drop-down boxes at the top of the screen to select different countries/regions and scenario files.[[File:WB flows.png|thumb|950x950px|Example of World Bank financial flows|center]]There are several features and options that can be accessed using the menu bar at the top of the screen. These options and features include: | ||
* [[Repeated Features#General%20Display%20Options|'''Continue''']]''':''' Go back to the previous menu or to the Main Menu of IFs. | |||
* '''View:''' Modify options for adjusting how data is displayed in the table: | |||
** '''Normal:''' Display data in absolute values. | |||
** '''Percent Change from the First Year:''' Show the percent change of the variable compared to its value in the first year displayed in the table. | |||
** '''Percent Change from the Base Case:''' Show the percent change of the variable compared to its value in Base Case scenario in the same year. | |||
<span style="font-size:xx-large;"></span> | * '''Switch:''' Click to switch the display from individual countries/regions to predefined groups. Click again (the menu will now say Use Country/Regions) to switch back to viewing countries/regions individually. | ||
* '''Help:''' Go to the corresponding page in the [[Main Page|Pardee Wiki]] for the current feature or display. | |||
The variables in the '''''World Bank Financial Flows''''' page table are organized into three categories. Annual Flows show the year-by-year financial transactions between countries and the World Bank, including loans disbursed ("From Bank") and repayments made ("To Bank"). Cumulative Position tracks the accumulated financial relationship over time, reflects total loans received and total repayments made, which provide a view of outstanding obligations or net balances. Finally, Sector of Flow disaggregates financial flows by major sectors, such as education, health, and water and sanitation, showing how World Bank resources are allocated across development priorities. | |||
= <span style="font-size:xx-large;">Infrastructure Profile</span> = | |||
<div style="text-align: center; color: red; font-weight: bold; font-size: 200%;"> | |||
Feature is no longer available or outdated in the model. | |||
</div> | |||
Infrastructure Profile is a sub-sub option, located under Specialized Display, which in turn is a sub-option of the Display option on the main menu of IFs. Infrastructure Profile is also located under the [[Main_Menu_Map|Main Menu Map]] options. | |||
Clicking on Infrastructure Profile allows the user to view multiple components of the infrastructure for a [[Country/Region,_Group_or_G-List|country/region or group]], including: Water and Sanitation, Transportation, Energy, Information-Communications Technology (ICT), and Knowledge Systems. Most of these components are a composite of different variables. The value of each of these variables is displayed in four ways: Computed Value, Expected Value Predicted from GDP per Capita at Purchasing Power Parity (PPP), Standard Error of Estimate, and Standard Errors of Value from Prediction. The user can change the year displayed in the Infrastructure Profile up to 2100 by clicking on the ‘Select Year’ dropdown box at the top-center of the screen | |||
The user can display the computed values for the variables over time in a [[General_Display_Options#Table_Use|table]] by clicking on a desired value. The table that appears displays the computed values over time according to several different [[Scenario_Description|scenarios]]. The user can also view a variable displayed in a [[General_Display_Options#Line_Graph,_Bar_Graph,_Scatter,_Etc.|graph]] by clicking on a given variable. After viewing the graph, the user can return to the Infrastructure Profile by clicking on continue. | |||
[[File:SAM.png|center|frame|Example of an infrastructure profile]] | |||
= <span style="font-size:xx-large;">Financial Profile</span> = | |||
<div style="text-align: center; color: red; font-weight: bold; font-size: 200%;"> | |||
Feature is no longer available or outdated in the model. | |||
</div> | |||
[[ | The Financial Profile sub-sub-option can be reached from the Display option on the Main Menu, the Specialized Display sub-option and the Financial Profile sub-sub-option. It is also located under the [[Main_Menu_Map|Main Menu Map]] options. | ||
When you select the Financial Profile from the Specialized Display menu, you are presented with a chart that divides financial information for any given country/region or group into Domestic and International data. The chart then organizes this data into absolute numbers, percentages of GDP and percentages of exports. | |||
Experiment with the Financial Profile. Assume you would like to know what trends you can see in global reserves held by all countries except for the United States. From the top of the Financial Profile menu first click on the [[Country/Region,_Group_or_G-List|Using Countries/Regions - Using Groups]] toggle. Scroll down the groups until you find the option for World Except USA. | |||
[[ | Choose a cell that you would like to explore more fully. If you would like to look at the total global reserves held by all countries except for the USA, click no the table where the Reserves row intersects with the Absolute column. This will bring up a prompt called Show Over Time. If you select this option, a [[General_Display_Options#Table_Use|table]] will open showing this value forecast using different Run-Result-Files. | ||
Another Financial Profile option is the Show Top Countries/Regions. Selecting this will bring up a new screen called the Financial Profile Filter. This feature of IFs allows users to quickly access countries who have the highest levels of certain financial data filtered as absolute numbers, percentages of GDP or percentages of exports. Selecting any one of the filters located at the top of the Financial Profile Filter page will organize the table into the 5 countries with the highest value for the selected filter. Click Continue to return to the Financial Profile menu. | |||
[[File:Dev3.gif|frame|center|Example of financial profile]] | |||
Latest revision as of 09:54, 11 July 2025
Development Profile
The Development Profile display can be reached from the Display option of the Main Menu, Specialized Display sub-option and Development Profile sub-sub-option. It is also located under the Main Menu Map options.
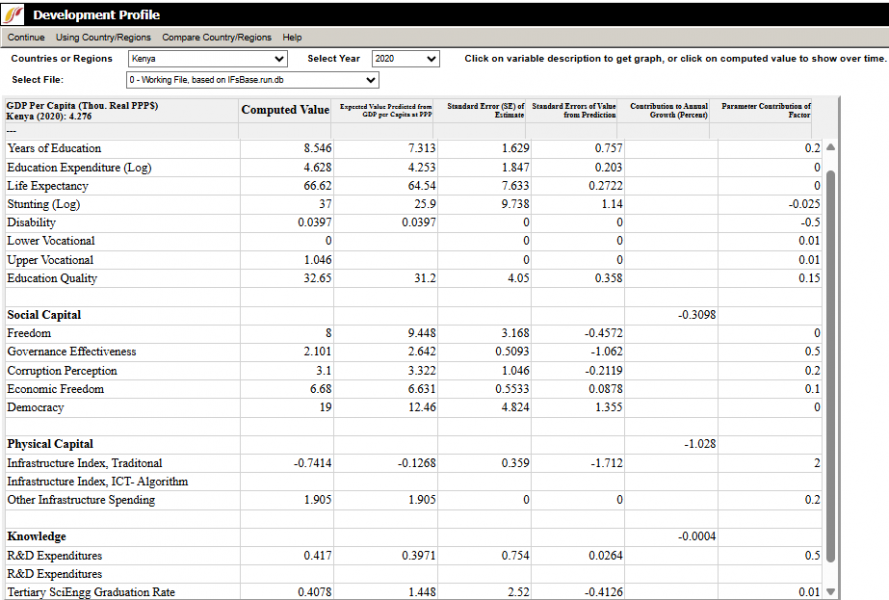
The purpose of the Development Profile display feature is to track how Human Capital, Social Capital, Physical Capital and Knowledge contribute to the annual growth of a country/region or a group. For purposes of development, it is helpful to understand what aspects of a country/region or group are helping or harming the growth of a country/region or group.
There are three dropdown menus at the top of the screen. Use the first toggle in the top-left corner to switch between regions or global groups (depending on the selection made in the Main Menu). To the right of the country/region or group scroll-down list, choose a year to display. Finally, use the third menu below to select the appropriate Scenario Run File.
The menu bar at the top of the screen includes the following tools:
- Continue: Go back to the previous menu or to the Main Menu of IFs.
- Using Country/Regions: Switch
- Compare Country/Regions: Select "Show" to display dropdown menus at the top of the screen: Select File is a selection of the scenario run for comparison, and Compare Groups or Countries specify options for selecting a comparison region or country. Select "Hide" to remove the comparison view and restore the display to a single country.
- Help: Go to the corresponding page in the Pardee Wiki for the current feature or display.
The left column of the table represents different variables calculated by IFs organized into categories. The Computed Value column includes the actual numbers calculated for the selected year (top right scroll-down list). These values are then used to calculate the Expected Value Predicted from GDP (Gross Domestic Product) Per Capita at PPP (Purchasing Power Parity). A Standard Error is then displayed, followed by a Standard Error of the Value from the Prediction. The final two values display how the categories Contributed to Annual Growth (as a percentage) and how their contribution can be displayed as a parameter.
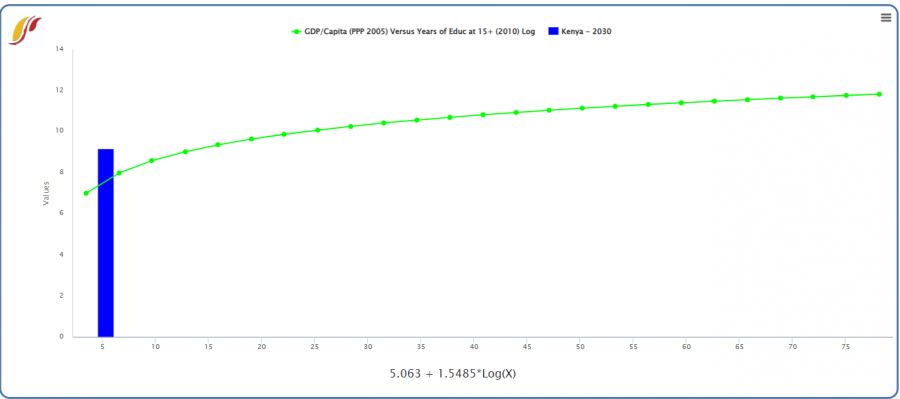
Click any variable displayed on the left to graph the Computed Value of that variable for the selected year, as well as a logarithmic graph of GDP at PPP compared to the variable. See an example below:
To see forecast over time for the selected variable, click on the number displayed in the Computed Value column. For more information on how to use the available table tools, see the Table Use page.
To visually represent the data, use a line graph or a bar graph, save the information, toggle between whole number representation or representation as a percentage of the base year, toggle between displaying results as cumulative totals, turn the interval average on or off, add or design a filter or set the time horizon for your information.
Social Accounting Matrix
The Social Accounting Matrix sub-sub-option can be reached from the Display option on the Main Menu, the Specialized Display sub-option and then the Social Accounting Matrix sub-sub-option. It is also located under the Main Menu Map options.
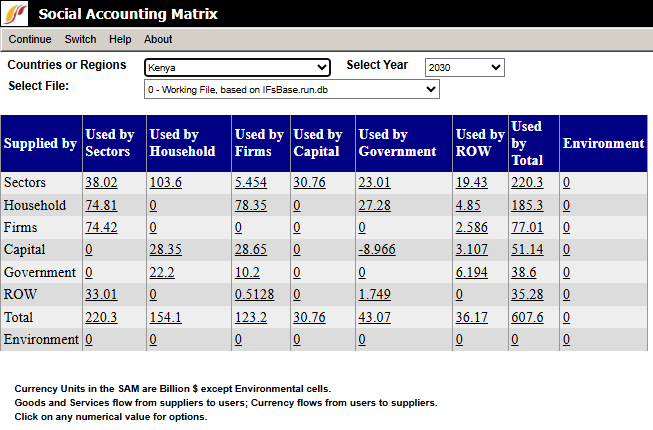
A Social Accounting Matrix (SAM) is an extension of an input-output table that economists use to show the inter-sectoral flows of goods and services within an economy (see the upper left-hand cell of the SAM). The SAM more generally displays flows among actor-classes in the socio-economic system. For instance, the cell in the government column and household row shows flows from the government to households (such as pension payments). The cell in the firms' column and government row similarly shows flows from firms to the government (such as tax payments). Double-click on certain numbers within the SAM table and this will open up a small window with options to Expand Cell, Show Over time, Explain Cell Content or Cancel the operations. When expanded, the SAM shows additional sectors and categories such as FDI outflows, worker remittances, aid donations, and debt repayments.
Move across countries/regions or groupings and across years with the drop-down boxes at the top of the screen.
There are several features and options that can be accessed using the menu bar at the top of the screen. These include:
- Continue: Go back to the previous menu or to the Main Menu of IFs.
- Switch: Modify the display settings of the SAM with the following options:
- Use Groups: Click to switch the display from individual countries/regions to predefined groups. Click again (the menu will now say Use Country/Regions) to switch back to viewing countries/regions individually.
- Percent Change From Base Case: This option toggles the display to show the percent change from the Base Case (Current Path) instead of absolute values. It helps to quickly identify relative differences between the selected run and the Base Case.
- Show Stocks or Switch to Show Flows: This option toggles between showing stocks (e.g., accumulated levels) and flows (e.g., yearly transactions) within the SAM.
- Expand SAM: Expand the SAM table to display a more detailed view of flows between sectors, households, firms, capital accounts, government sectors, and the rest of the world (ROW). Additional categories such as FDI outflows, worker remittances, aid donations, and debt repayments are included in the expanded view.
- Help: Go to the corresponding page in the Pardee Wiki for the current feature or display.
- About: Click to display short description of the feature being used.
Note: When toggling between stocks and flows, users may note that some of the stocks are not present. This is because this feature of IFs is currently under development.
Growth Accounting
The Growth Accounting sub-option can be reached from the Display option on the Main Menu, the Specialized Display sub-option, and then the Growth Accounting sub-option. It is also located under the Main Menu Map options.
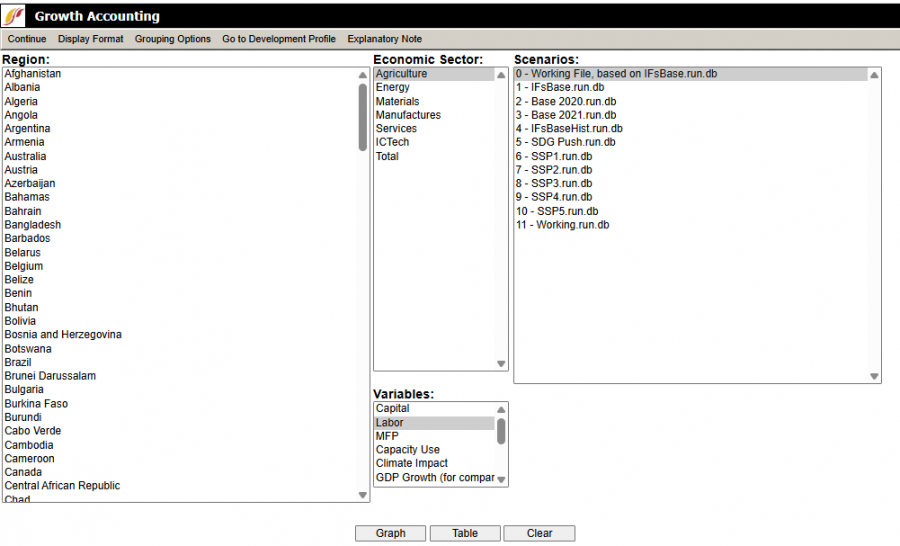
This display provides historical and forecasted data on the sources of economic growth, decomposing GDP growth into contributions from factors such as capital accumulation, labor force growth, multifactor productivity (MFP), capacity utilization, and climate impacts. Analyze these contributions across different countries, sectors, and scenarios.
Use the drop-down boxes at the top of the screen to select different Regions (countries), Economic Sectors, Scenarios, and Variables.
There are several features and options that can be accessed using the menu bar at the top of the screen. These options include:
- Continue: Go back to the previous menu or to the Main Menu of IFs.
- Print: Print the current display or export it to a printable format.
- Display Format: Modify how the data is displayed:
- Change to Bar Chart: Display the selected variables in a bar chart format.
- Change to Line Graph: Display the selected variables in a line graph format.
- Set Title, Display Interval, or Year: Modify of the title, time interval, year labeling, and X/Y axis for graphs.
- Display/Run Horizon: Adjust the horizon for the data display.
- Annual Growth Rate: Pull up annualized growth rates. When unselected, it presents full interval growth rates.
- Adjustment to Actual Growth: Adjust modeled outputs to better align with historical actual growth data.
- Decompose MFP: Break down multifactor productivity into its detailed components.
- Grouping Options: Select between viewing Country/Regions, Groups or G-lists.
- Using Countries/Regions: Display individual countries or regions.
- Using Groups: Display groups.
- Using Decomposed Groups: Select a group but display data separately for each country within the selected group.
- Using G-Lists: Customized group lists for analysis.
- Label Options: Adjust labeling settings for graphs or tables to customize the appearance of outputs.
- Use First Dimension Only: Label based on the first selected dimension.
- Use Sector Only: Display only the sector names.
- Use Scenario Names Only: Display only the scenario names.
- Use Components Only: Display only component names.
- Use Alias for Group Names: Replace group names with user-defined aliases.
- Reset Labels: Return all labels to default settings.
- Go to Development Profile: Go directly to a country or region’s detailed Development Profile.
- Explanatory Note: View a brief description of the Growth Accounting display and its underlying methodology.
- Help: Go to the corresponding in the Pardee Wiki for the current feature or display.
The Variables available in the Growth Accounting display include:
- Capital: Contribution of physical capital accumulation to GDP growth.
- Labor: Contribution of labor force growth to GDP growth.
- Multifactor Productivity (MFP): Contribution of improvements in efficiency and technology to GDP growth. MFP is further disaggregated into several components (see below).
- Capacity Use: Impact of variations in the utilization rate of available capital and labor.
- Climate Impact: Effect of climate change on productive capacity.
- GDP Growth (for comparison): Overall GDP growth rate combining all components.
- Technology Base MFP: Impact of advancements in technological infrastructure and innovation.
- Knowledge MFP: Effect of accumulated knowledge and research on productivity.
- Human Capital MFP: Contribution of improvements in education, skills, and workforce capabilities.
- Social Capital MFP: Impact of societal institutions, trust, and networks on economic productivity.
- Physical Capital MFP: Productivity gains linked to better utilization or quality of physical assets.
- Correction MFP: Adjustments made to account for modeling or measurement inconsistencies.
After making selections, choose to Graph the results, view them in a Table, or Clear the selections to start over by clicking one of these options at the bottom of the page.
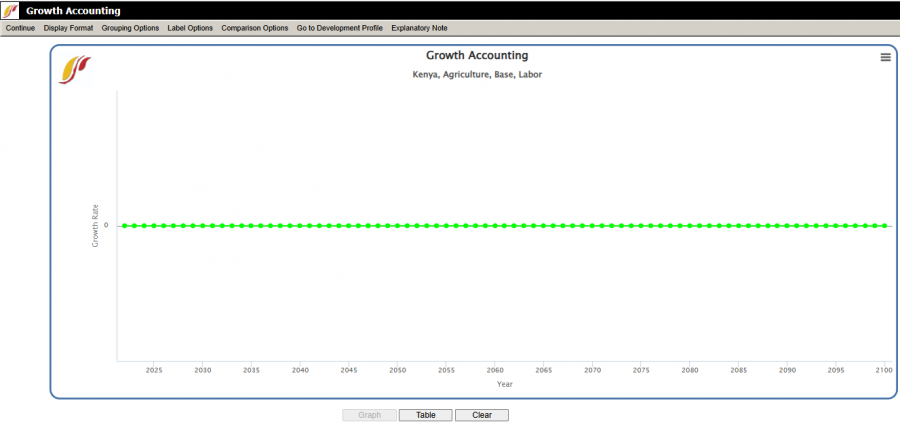
For example, the graph above shows the contribution of labor to agricultural growth in Kenya under the IFsBase scenario. The x-axis represents years from 2020 to 2100, while the y-axis displays the growth rate contribution of the labor factor. For more information on how to use the available table tools, see the Table Use page.
World Bank Financial Flows
The World Bank Financial Flows sub-sub-option can be reached from the Display option on the Main Menu, the Specialized Display sub-option and then the World Bank Financial Flows sub-sub-option. It is also located under the Main Menu Map options.
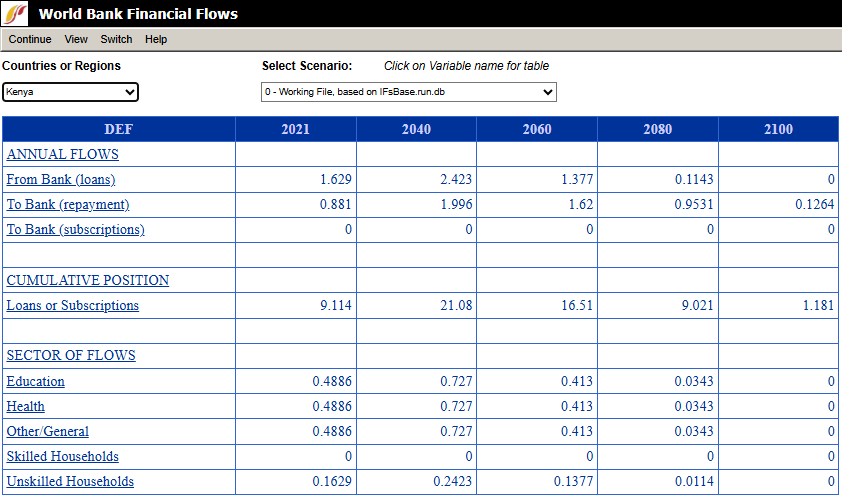
This display provides historical and forecasted data on loans, repayments, and sectoral financial interactions between countries and the World Bank. Click on any variable name to open a table displaying the values for that variable over time and different scenarios. From the table menu options, create a graph, map the data, save it, or adjust display settings. For more information on how to use the available table tools, see the Table Use page.
Use the drop-down boxes at the top of the screen to select different countries/regions and scenario files.
There are several features and options that can be accessed using the menu bar at the top of the screen. These options and features include:
- Continue: Go back to the previous menu or to the Main Menu of IFs.
- View: Modify options for adjusting how data is displayed in the table:
- Normal: Display data in absolute values.
- Percent Change from the First Year: Show the percent change of the variable compared to its value in the first year displayed in the table.
- Percent Change from the Base Case: Show the percent change of the variable compared to its value in Base Case scenario in the same year.
- Switch: Click to switch the display from individual countries/regions to predefined groups. Click again (the menu will now say Use Country/Regions) to switch back to viewing countries/regions individually.
- Help: Go to the corresponding page in the Pardee Wiki for the current feature or display.
The variables in the World Bank Financial Flows page table are organized into three categories. Annual Flows show the year-by-year financial transactions between countries and the World Bank, including loans disbursed ("From Bank") and repayments made ("To Bank"). Cumulative Position tracks the accumulated financial relationship over time, reflects total loans received and total repayments made, which provide a view of outstanding obligations or net balances. Finally, Sector of Flow disaggregates financial flows by major sectors, such as education, health, and water and sanitation, showing how World Bank resources are allocated across development priorities.
Infrastructure Profile
Feature is no longer available or outdated in the model.
Infrastructure Profile is a sub-sub option, located under Specialized Display, which in turn is a sub-option of the Display option on the main menu of IFs. Infrastructure Profile is also located under the Main Menu Map options.
Clicking on Infrastructure Profile allows the user to view multiple components of the infrastructure for a country/region or group, including: Water and Sanitation, Transportation, Energy, Information-Communications Technology (ICT), and Knowledge Systems. Most of these components are a composite of different variables. The value of each of these variables is displayed in four ways: Computed Value, Expected Value Predicted from GDP per Capita at Purchasing Power Parity (PPP), Standard Error of Estimate, and Standard Errors of Value from Prediction. The user can change the year displayed in the Infrastructure Profile up to 2100 by clicking on the ‘Select Year’ dropdown box at the top-center of the screen
The user can display the computed values for the variables over time in a table by clicking on a desired value. The table that appears displays the computed values over time according to several different scenarios. The user can also view a variable displayed in a graph by clicking on a given variable. After viewing the graph, the user can return to the Infrastructure Profile by clicking on continue.
Financial Profile
Feature is no longer available or outdated in the model.
The Financial Profile sub-sub-option can be reached from the Display option on the Main Menu, the Specialized Display sub-option and the Financial Profile sub-sub-option. It is also located under the Main Menu Map options.
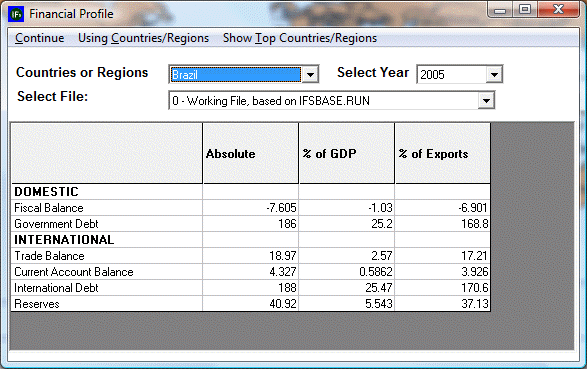
When you select the Financial Profile from the Specialized Display menu, you are presented with a chart that divides financial information for any given country/region or group into Domestic and International data. The chart then organizes this data into absolute numbers, percentages of GDP and percentages of exports.
Experiment with the Financial Profile. Assume you would like to know what trends you can see in global reserves held by all countries except for the United States. From the top of the Financial Profile menu first click on the Using Countries/Regions - Using Groups toggle. Scroll down the groups until you find the option for World Except USA.
Choose a cell that you would like to explore more fully. If you would like to look at the total global reserves held by all countries except for the USA, click no the table where the Reserves row intersects with the Absolute column. This will bring up a prompt called Show Over Time. If you select this option, a table will open showing this value forecast using different Run-Result-Files.
Another Financial Profile option is the Show Top Countries/Regions. Selecting this will bring up a new screen called the Financial Profile Filter. This feature of IFs allows users to quickly access countries who have the highest levels of certain financial data filtered as absolute numbers, percentages of GDP or percentages of exports. Selecting any one of the filters located at the top of the Financial Profile Filter page will organize the table into the 5 countries with the highest value for the selected filter. Click Continue to return to the Financial Profile menu.
