India's Health Data: Difference between revisions
AltheaDitter (talk | contribs) No edit summary |
AltheaDitter (talk | contribs) No edit summary |
||
| Line 26: | Line 26: | ||
Infant mortality in India was found in a [[Human_Development_Report_of_India|Human Development Report of India]] and on the [[NITI_Aayog|NITI Aayog]] website. The series runs from 1981, 1991, 2004-2005, 2008-2013. | Infant mortality in India was found in a [[Human_Development_Report_of_India|Human Development Report of India]] and on the [[NITI_Aayog|NITI Aayog]] website. The series runs from 1981, 1991, 2004-2005, 2008-2013. | ||
[[File:India InfMort v728.jpg]]Infant mortality has been declining across all provinces since the beginning of the historical data in 1981. The highest infant mortality rates were historically in Madhya Pradesh and Orissa. Orissa declines significantly in the forecasts, where as Madhya Pradesh sees a small increase at model initialization in 2014 followed by a steady decline. Manipur and Kerala have the lowest rates of infant mortality historically and Kerala is forecast to remain at the bottom through the end of the time horizon. | |||
Latest revision as of 18:39, 18 May 2017
Crude Birth Rates
Crude birth rates consist of two series that were blended together. Both were published by the Ministry of Health and Family Welfare in India. The first series runs from 1971 through 2012 and has the bulk of the historical data. The second series was scraped from a Human Development Report of India in PDF format and is the 2014 data. These two series blend together smoothly.
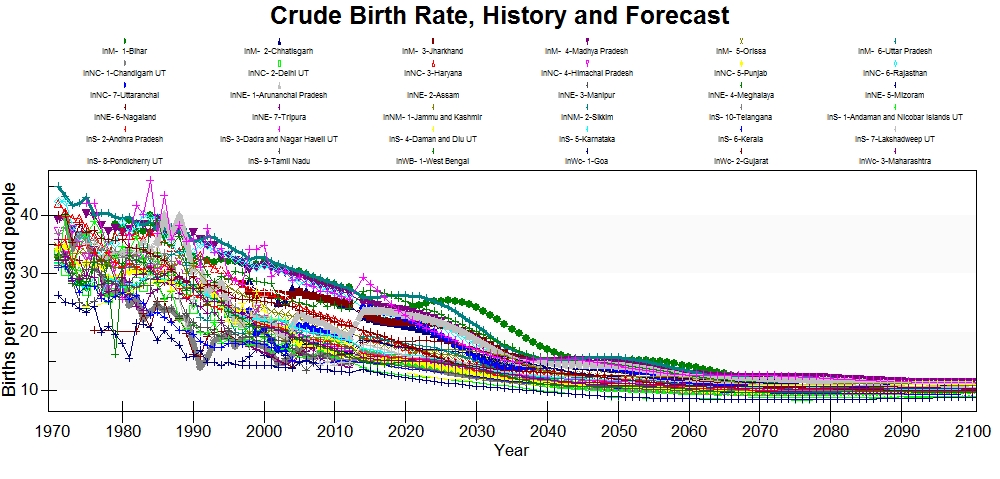 Dadra and Nagar Haveli, Bihar, and Uttar Pradesh have the highest crude birth rates historically and into the forecast. Dadra and Nagar Haveli and Jhakhard have a significant increase at the model's initialization in 2014. All states and union territories experience a steady decline through the end of the time horizon.
Crude Death Rates
Crude death rates consist of two series that were blended together. Both series were published by the Ministry of Health and Family Welfare in India. The first series runs from 1971 through 2012 and has the bulk of the historical data. The second series was scraped from a Human Development Report of India in PDF format and is the 2014 data. These two series blend well and there do not appear to be any transients.
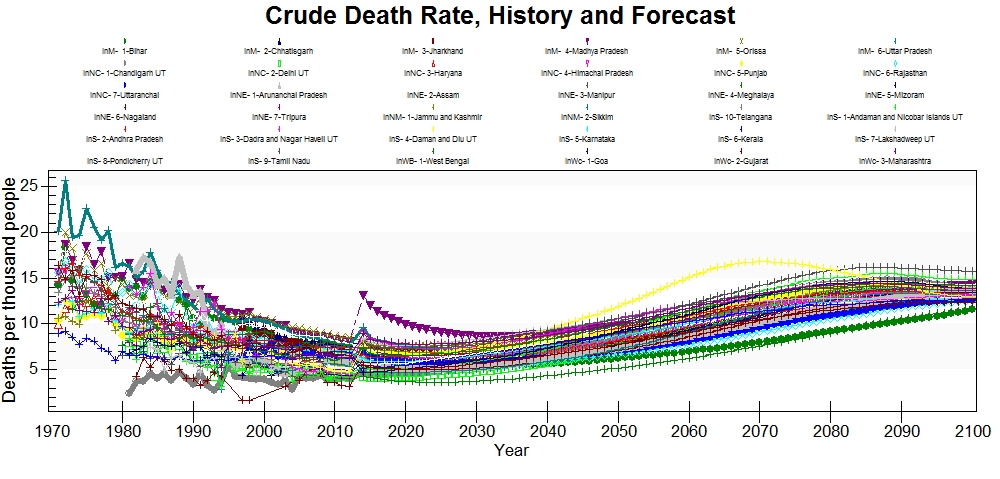 Historically the highly populated state of Uttar Pradesh has the highest crude death rates. At model initialization there is an upward spike in all states and territories, most have only a small increase, but Madhya Pradesh has a substantial increase. The forecasts show Madhya Pradesh having the highest crude death rates into the future until sometime around 2040. After 2040 Daman and Diu's crude death rates are forecast to grow to be significantly higher than the rest of the states. This behavior is believed to be driven by the unusual age-sex cohort structure in this union territory. Daman and Diu have, what appears to be, a large migrant worker population. There are a disproportionate number of young working-aged men relative to the total population. It would appear that the model is forecasting this population's eventual deaths and because there are few children in Daman and Diu presently, the death rate will be disproportionately high.
LifeExpectFemale
Female life expectancy was found in a Human Development Report of India and from the Planning Commission of the Government of India. This series runs from 1981-1984, 1991-1995, 2001-2006, 2011.
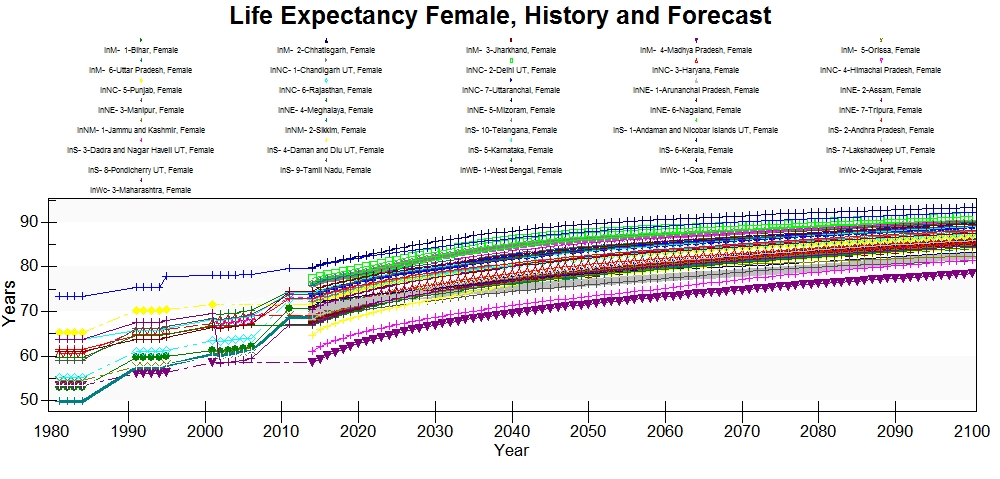 Kerala and Goa have the longest female life expectancies whereas, Madhya Pradesh and Dadra and Nagar Haveli have the shortest female life expectancies. Madhya Pradesh has about the same female life expectancy in 2001 as it does in the first year of forecast in 2014.
LifeExpectMale
Male life expectancy was found in a Human Development Report of India and from the Planning Commission of the Government of India. This series runs from 1981-1984, 1991-1995, 2001-2006, 2011.
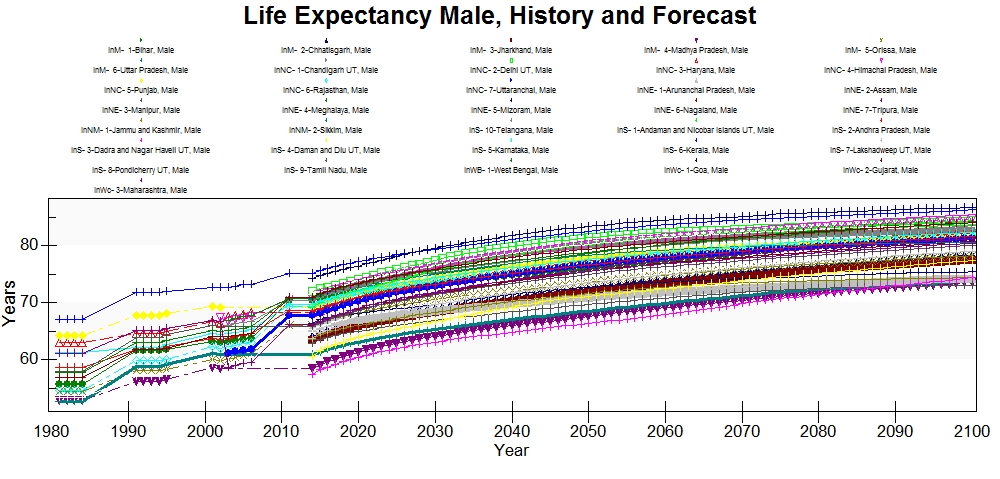 Male life expectancy is the longest in Goa and Kerala, like female life expectancy. Madhya Pradesh and Dadra and Nagar Haveli have the shortest life expectancies.
InfMortMedUNPD
Infant mortality in India was found in a Human Development Report of India and on the NITI Aayog website. The series runs from 1981, 1991, 2004-2005, 2008-2013.
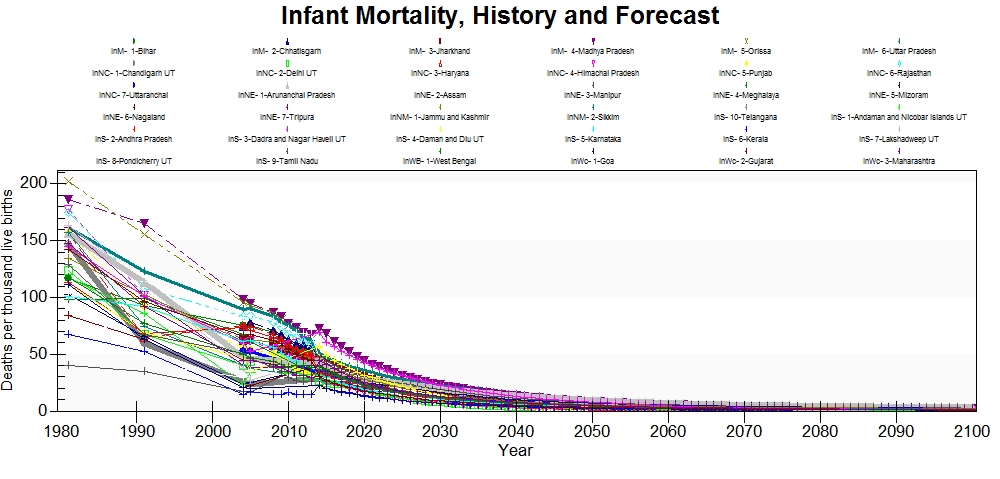 Infant mortality has been declining across all provinces since the beginning of the historical data in 1981. The highest infant mortality rates were historically in Madhya Pradesh and Orissa. Orissa declines significantly in the forecasts, where as Madhya Pradesh sees a small increase at model initialization in 2014 followed by a steady decline. Manipur and Kerala have the lowest rates of infant mortality historically and Kerala is forecast to remain at the bottom through the end of the time horizon.