IFs Dyadic Trade Data: Difference between revisions
Yutang.Xiong (talk | contribs) mNo edit summary |
Yutang.Xiong (talk | contribs) mNo edit summary |
||
| Line 27: | Line 27: | ||
====WITS==== | ====WITS==== | ||
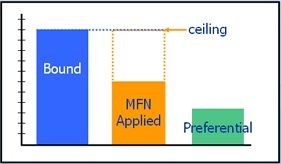
[https://wits.worldbank.org/ WITS] is a powerful tool that provides access to international merchandise trade, tariff and non-tariff measures (NTM) data. As of now, we rely on WITS for collecting tariff data. WITS only provides three types of tariffs- the bond rate (highest), MFN, and preferential rate (lowest). See the graph illustrated below, [https://wits.worldbank.org/wits/wits/witshelp/content/data_retrieval/p/intro/c2.types_of_tariffs.htm#:~:text=The%203%20types%20of%20tariffs,other%20two%20as%20illustrated%20below. according to the data manual of WITS]. In addition, it provides the so called “effective applied tariff”, which is being used for our dyadic data. | [https://wits.worldbank.org/ WITS] is a powerful tool that provides access to international merchandise trade, tariff and non-tariff measures (NTM) data. As of now, we rely on WITS for collecting tariff data. WITS only provides three types of tariffs- the bond rate (highest), MFN, and preferential rate (lowest). See the graph illustrated below, [https://wits.worldbank.org/wits/wits/witshelp/content/data_retrieval/p/intro/c2.types_of_tariffs.htm#:~:text=The%203%20types%20of%20tariffs,other%20two%20as%20illustrated%20below. according to the data manual of WITS]. In addition, it provides the so called “effective applied tariff”, which is being used for our dyadic data. It's definition is “If a preferential tariff exists, it will be used as the effectively applied tariff. Otherwise, the MFN applied tariff will be used.” | ||
There are several limitations worth noting for the WITS data. First, its trade data are directly from UN Comtrade, which lacks the harmonization process implemented by BACI. Hence, currently, IFs solely rely on BACI for trade information (imports and exports). Secondly, there are imperfections in tariff data from WITS where certain categories of commodities have unrealistic tariff values. In addition, there are missing values (unreported values) in tariffs. Lastly, any special tariff barriers, such as additional tariffs under US-China trade war, are not recorded. Adding these exceptional tariff rates into our IFs database will require additional manual labor unless a global data source appears. It is suggested that users can use scenarios to simulate such tariffs. | |||
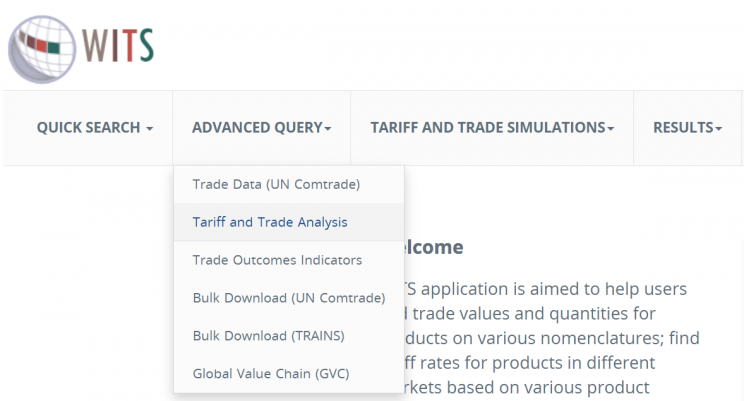
[[File:3 types of tariff for a given product, WITS.png|none|thumb]]To query and download tariff data from WITS, a registration is required. Once logged in, you will be able to access tariff data for free. Note that a paid subscription from UN Comtrade is required to use the bulk download option, hence, you will have to query the data multiple times in order to get the full coverage. In order to query the data, select ADVANCED QUERY from the drop-down menu and click on Tariff and Trade Analysis. You will be directed to the Tariff and Trade Analysis interface where you can create data queries on your own. Make sure you pick TRAINS as your data source. | [[File:3 types of tariff for a given product, WITS.png|none|thumb]]To query and download tariff data from WITS, a registration is required. Once logged in, you will be able to access tariff data for free. Note that a paid subscription from UN Comtrade is required to use the bulk download option, hence, you will have to query the data multiple times in order to get the full coverage. In order to query the data, select ADVANCED QUERY from the drop-down menu and click on Tariff and Trade Analysis. You will be directed to the Tariff and Trade Analysis interface where you can create data queries on your own. Make sure you pick TRAINS as your data source. | ||
[[File:Interface of the WITS Data Query Tool.png|border|744x744px]] | [[File:Interface of the WITS Data Query Tool.png|border|744x744px]] | ||
| Line 37: | Line 39: | ||
* ''Include Effective Applied rates'' as the duty type, with ''UNCTAD'' as the computing method for average; | * ''Include Effective Applied rates'' as the duty type, with ''UNCTAD'' as the computing method for average; | ||
* It is highly recommended that you download one year of data at a time, because WITS sets an internal upper limit for the total number of rows a resultant data query can carry (49,999,999 rows). | * It is highly recommended that you download one year of data at a time, because WITS sets an internal upper limit for the total number of rows a resultant data query can carry (49,999,999 rows). | ||
Each data query will take WITS some time to process, and you can download each data table in your desired format, as in .csv files. In the data processing steps, you will need to merge tariff data from WITS and trade data from BACI to calculate tariff revenue and weighted tariff. | |||
Revision as of 22:16, 6 February 2025
IFs dyadic database provides following sets of trade related tables for each sector (agriculture, energy, manufacturing, materials, ICT, and services), as well as for the overall sectors (goods & total).
- Exports & Imports in constant $2017
- Trade Complementarity Index (TCI)
- Tariff Revenues
- Weighted Tariff
There are 34 tables in total. Because there are no TCI & weighted tariff tables for the service sector. Raw data of trade and tariffs are originally provided by the World Bank's World Integrated Trade Solution (WITS) and the United Nations Comtrade database. However, in order to get a harmonized bilateral trade data, we directly gather trade values from the Centre d'Etudes Prospectives et d'Informations Internationales' BACI database. For more details on BACI's approach regarding their harmonization process, please refer to their methodology note here. However, trade data for the services sector are still collected from the UN Comtrade, as well as tariffs.
Product Concordance
Trade values are normally provided at commodity level using 6-digit HS nomenclature, an international standard reported under the UN Comtrade. Details on the nomencalture can be found here. Note that the Harmonized System (HS) codes are constantly updated throughout years, and currently we rely on converting all the data under one HS system, which is HS92, also known as HS0. The concordance can be done using the official mapping system, accessible through World Bank WITS' product concordance page.
In IFs, we only present economic activities under IFs sectors (agriculture, energy, manufacturing, materials, ICT, and services) as well as GTAP sectors. Hence, during the data processing steps, 6-digit commodity level values are aggregated into GTAP sectors first, and then IFs sectors. The concordance table between HS codes and GTAP sectors can be found under WITS' product concordance page. The mapping table between GTAP sectors and IFs sectors can be found in the IFs system, under the table GTAPSectorConversion in the DATA/IFs.db file.
Data Sources
The data collection process for each data source is detailed below.
BACI
Data from BACI can be freely accessed from their official website. All years of data needed for IFs (1995 - now) can be downloaded under HS92 system. You will receive a zipped file with trade data by year, country and product codes, as well as a text note explaining the structure of data. Trade data by year are stored under the .csv format, with trade flows at the year - exporter - importer - product level. Products are under the Harmonized System 6-digit nomenclature, values are in thousand USD, and quantities are in metric tons. Note that trade flows from BACI only cover the goods sector in IFs, i.e., excluding services from the total trade.
UN Comtrade
Trade flows in services are downloaded from the UN Comtrade database. The database requires a log-in, which can be done directly with your social account (Google for instance). If you are familiar with querying the API, you can also directly query the data using their API service. Again, data accessing through API also requires a log-in.
Unlike trade flows of goods, IFs do not disaggregate service trade into smaller sectors, the data downloading and processing steps are fairly straightforward for service trade. However, to mimic the harmonization process from BACI, we need to ensure that exports and imports from the same country-pair are mirrored.
WITS
WITS is a powerful tool that provides access to international merchandise trade, tariff and non-tariff measures (NTM) data. As of now, we rely on WITS for collecting tariff data. WITS only provides three types of tariffs- the bond rate (highest), MFN, and preferential rate (lowest). See the graph illustrated below, according to the data manual of WITS. In addition, it provides the so called “effective applied tariff”, which is being used for our dyadic data. It's definition is “If a preferential tariff exists, it will be used as the effectively applied tariff. Otherwise, the MFN applied tariff will be used.”
There are several limitations worth noting for the WITS data. First, its trade data are directly from UN Comtrade, which lacks the harmonization process implemented by BACI. Hence, currently, IFs solely rely on BACI for trade information (imports and exports). Secondly, there are imperfections in tariff data from WITS where certain categories of commodities have unrealistic tariff values. In addition, there are missing values (unreported values) in tariffs. Lastly, any special tariff barriers, such as additional tariffs under US-China trade war, are not recorded. Adding these exceptional tariff rates into our IFs database will require additional manual labor unless a global data source appears. It is suggested that users can use scenarios to simulate such tariffs.
To query and download tariff data from WITS, a registration is required. Once logged in, you will be able to access tariff data for free. Note that a paid subscription from UN Comtrade is required to use the bulk download option, hence, you will have to query the data multiple times in order to get the full coverage. In order to query the data, select ADVANCED QUERY from the drop-down menu and click on Tariff and Trade Analysis. You will be directed to the Tariff and Trade Analysis interface where you can create data queries on your own. Make sure you pick TRAINS as your data source.
A data query for tariff information should have following inputs selected-
- All countries All -- All from Predefined Country Groups as Reporters (Importers) and Partners (Exporters), as well as the enablement of Country Group Breakdown;
- ALL3 -- Sub-Heading (all 6-digit HS codes) under the Clusters menu for the Products. Ensure that HS - Combined is used as the nomenclature;
- Include Effective Applied rates as the duty type, with UNCTAD as the computing method for average;
- It is highly recommended that you download one year of data at a time, because WITS sets an internal upper limit for the total number of rows a resultant data query can carry (49,999,999 rows).
Each data query will take WITS some time to process, and you can download each data table in your desired format, as in .csv files. In the data processing steps, you will need to merge tariff data from WITS and trade data from BACI to calculate tariff revenue and weighted tariff.

