IFs Dyadic Trade Data
IFs dyadic database provides following sets of trade related tables for each sector (agriculture, energy, manufacturing, materials, ICT, and services), as well as for the overall sectors (goods & total).
- Exports & Imports in constant $2017
- Trade Complementarity Index (TCI)
- Tariff Revenues
- Weighted Tariff
There are 34 tables in total. Because there are no TCI & weighted tariff tables for the service sector. Raw data of trade and tariffs are originally provided by the World Bank's World Integrated Trade Solution (WITS) and the United Nations Comtrade database. However, in order to get a harmonized bilateral trade data, we directly gather trade values from the Centre d'Etudes Prospectives et d'Informations Internationales' BACI database. For more details on BACI's approach regarding their harmonization process, please refer to their methodology note here. However, trade data for the services sector are still collected from the UN Comtrade, as well as tariffs.
Product Concordance
Trade values are normally provided at commodity level using 6-digit HS nomenclature, an international standard reported under the UN Comtrade. Details on the nomencalture can be found here. Note that the Harmonized System (HS) codes are constantly updated throughout years, and currently we rely on converting all the data under one HS system, which is HS92, also known as HS0. The concordance can be done using the official mapping system, accessible through World Bank WITS' product concordance page.
In IFs, we only present economic activities under IFs sectors (agriculture, energy, manufacturing, materials, ICT, and services) as well as GTAP sectors. Hence, during the data processing steps, 6-digit commodity level values are aggregated into GTAP sectors first, and then IFs sectors. The concordance table between HS codes and GTAP sectors can be found under WITS' product concordance page. The mapping table between GTAP sectors and IFs sectors can be found in the IFs system, under the table GTAPSectorConversion in the DATA/IFs.db file.
Data Sources
The data collection process for each data source is detailed below.
BACI
Data from BACI can be freely accessed from their official website. All years of data needed for IFs (1995 - now) can be downloaded under HS92 system. You will receive a zipped file with trade data by year, country and product codes, as well as a text note explaining the structure of data. Trade data by year are stored under the .csv format, with trade flows at the year - exporter - importer - product level. Products are under the Harmonized System 6-digit nomenclature, values are in thousand USD, and quantities are in metric tons. Note that trade flows from BACI only cover the goods sector in IFs, i.e., excluding services from the total trade.
UN Comtrade
Trade flows in services are downloaded from the UN Comtrade database. The database requires a log-in, which can be done directly with your social account (Google for instance). If you are familiar with querying the API, you can also directly query the data using their API service. Again, data accessing through API also requires a log-in.
Unlike trade flows of goods, IFs do not disaggregate service trade into smaller sectors, the data downloading and processing steps are fairly straightforward for service trade. However, to mimic the harmonization process from BACI, we need to ensure that exports and imports from the same country-pair are mirrored.
WITS
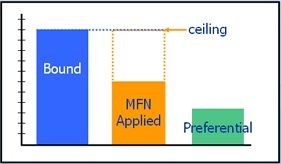
WITS is a powerful tool that provides access to international merchandise trade, tariff and non-tariff measures (NTM) data. As of now, we rely on WITS for collecting tariff data. WITS only provides three types of tariffs- the bond rate (highest), MFN, and preferential rate (lowest). See the graph illustrated below, according to the data manual of WITS. In addition, it provides the so called “effective applied tariff”, which is being used for our dyadic data. It's definition is “If a preferential tariff exists, it will be used as the effectively applied tariff. Otherwise, the MFN applied tariff will be used.”
There are several limitations worth noting for the WITS data. First, its trade data are directly from UN Comtrade, which lacks the harmonization process implemented by BACI. Hence, currently, IFs solely rely on BACI for trade information (imports and exports). Secondly, there are imperfections in tariff data from WITS where certain categories of commodities have unrealistic tariff values. In addition, there are missing values (unreported values) in tariffs. Lastly, any special tariff barriers, such as additional tariffs under US-China trade war, are not recorded. Adding these exceptional tariff rates into our IFs database will require additional manual labor unless a global data source appears. It is suggested that users can use scenarios to simulate such tariffs.
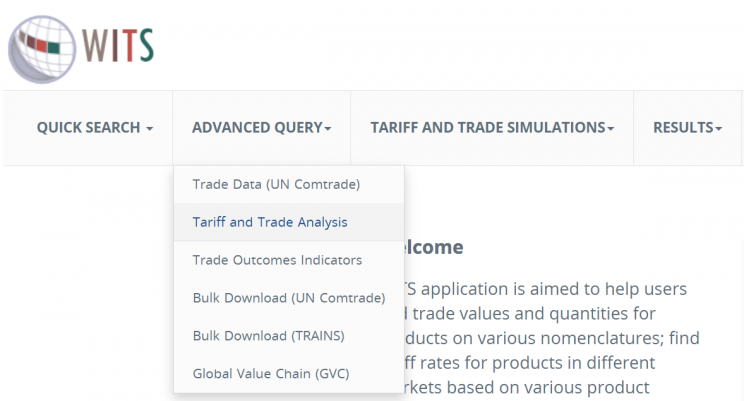
To query and download tariff data from WITS, a registration is required. Once logged in, you will be able to access tariff data for free. Note that a paid subscription from UN Comtrade is required to use the bulk download option, hence, you will have to query the data multiple times in order to get the full coverage. In order to query the data, select ADVANCED QUERY from the drop-down menu and click on Tariff and Trade Analysis. You will be directed to the Tariff and Trade Analysis interface where you can create data queries on your own. Make sure you pick TRAINS as your data source.
A data query for tariff information should have following inputs selected-
- All countries All -- All from Predefined Country Groups as Reporters (Importers) and Partners (Exporters), as well as the enablement of Country Group Breakdown;
- ALL3 -- Sub-Heading (all 6-digit HS codes) under the Clusters menu for the Products. Ensure that HS - Combined is used as the nomenclature;
- Include Effective Applied rates as the duty type, with UNCTAD as the computing method for average;
- It is highly recommended that you download one year of data at a time, because WITS sets an internal upper limit for the total number of rows a resultant data query can carry (49,999,999 rows).
Each data query will take WITS some time to process, and you can download each data table in your desired format, as in .csv files. In the data processing steps, you will need to merge tariff data from WITS and trade data from BACI to calculate tariff revenue and weighted tariff.
Data Processing
We process all trade related tables through Python scripts, which can be found on our GitHub repository. Here, we only describe the general process. Users are encouraged to read the GitHub repo if you want to understand, replicate, or even improve our data processing procedure. As stated at the beginning of this page, IFs provide four sets of trade related dyadic data tables.
Exports & Imports
There are 16 tables in total, with 8 tables for each trade flow. Within each trade flow (exports or imports), trade values are separated into sub-sectors,
, where
.
Trade values from BACI are recorded at 6-digit HS code level. To aggregate trade values into IFs sectors, simply use the concordance table provided in the GitHub repo. Note that the mapping table from HS code to GTAP is directly provided by WITS, but the mapping table between GTAP to IFs can be altered if needed. In addition to aggregation, following data manipulation steps are also done,
- Trade values in BACI are in current USD. We use USD deflator of the United States provided by the World Bank to convert all trade values to constant 2017 USD. It is debatable whether this is the best or even the correct approach, because GDP conversion is itself a complicated process.
- Some historical data were reported by economic organizations instead of individual countries, e.g., South African Customs Union (SACU), we use each member's economic size, i.e., GDP, to proportionally distribute their trade values.
Trade Complementarity Index
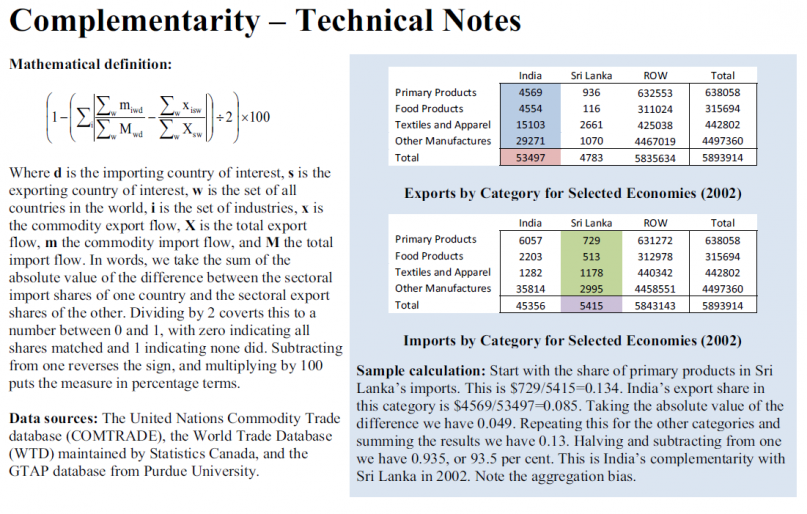
TCI measures how well a country's exports match another country's imports. Its definition is The sum of the absolute value of the difference between the import category shares and the export shares of the countries under study, divided by two. The index is converted to percentage form. Its range of values takes a value between 0 and 100, with zero indicating no overlap and 100 indicating a perfect match in the import/export pattern. The graph below shows an example of TCI calculation,
Since we have trade values down to the commoditiy level, we calculate the TCI indices for all the sub-sectors under Goods (agriculture, energy, ICT, materials, and manufacturing), as well as the TCI for overall Goods. Hence, there are 6 TCI tables in total in the IFs dyadic database. Note that IFs do not have TCI for the services sector because we currenty do not have sub-sectoral data for services. As you can see from the example above, calculating TCI can take a substantial amount of time, depending on the processing power and RAM capacity your device has. In the calculation of TCI, you will still need to separate trade values for those economic organizations, but there is no need for currency conversion.
Tariff Revenues & Weighted Tariff
There are 12 bilateral tables for tariff revenues and weighted tariffs, with 2 tables for each goods sector (goods, agriculture, energy, ICT, materials, and manufacturing). First, we calculate tariff revenues for each commodity (at 6-digit HS code level) after merging trade data from BACI and tariff data from WITS. Then, we aggregate tariff revenues for each country pair for each sector, and divide them by their corresponding trade values. Again, trade values for each economic organization are proportionally broken down to country level before this process, and you do need currency conversion because trade revenues need to match IFs' unit, which is now in constant 2017 USD.
For tariff data from WITS, you also need to deal with economic organiations, such as the European Union. However, unlike trade values, we simply assign those unions' rates to their member states. During this process, you need to be aware of membership changes throughout the years. Missing values in WITS also need to be imputed. For a commodity traded between a country pair that is recorded under BACI but not presented by WITS. We look for the average effective applied tariff rate the same importer charged to the rest of world for that commodity. If the first imputation method fails, we look for the average effective applied tariff rate charged by the rest of world for that commodity. If both imputation methods fail, we implement 0 tariff for that commodity.
Dyadic Trade Tables in IFs
All trade related tables are listed below,
| Table | Definition | Units | Years |
|---|---|---|---|
| SeriesExportsTotal | Exports from actor to partner; BACI goods and COMTRADE services | USD (constant 2017) | 2000-2022 |
| SeriesImportsTotal | Imports from partner to actor ; BACI goods and COMTRADE services | USD (constant 2017) | 2000-2022 |
| SeriesExportsAg | Exports from actor to partner, agriculture | USD (constant 2017) | 1995-2022 |
| SeriesImportsAg | Imports by actor from partner, agriculture | USD (constant 2017) | 1995-2022 |
| SeriesExportsEn | Exports from actor to partner, energy | USD (constant 2017) | 1995-2022 |
| SeriesImportsEn | Imports by actor from partner, energy | USD (constant 2017) | 1995-2022 |
| SeriesExportsICT | Exports from actor to partner, ICT | USD (constant 2017) | 1995-2022 |
| SeriesImportsICT | Imports by actor from partner, ICT | USD (constant 2017) | 1995-2022 |
| SeriesExportsMan | Exports from actor to partner, manufacturing | USD (constant 2017) | 1995-2022 |
| SeriesImportsMan | Imports by actor from partner, manufacturing | USD (constant 2017) | 1995-2022 |
| SeriesExportsMat | Exports from actor to partner, materials | USD (constant 2017) | 1995-2022 |
| SeriesImportsMat | Imports by actor from partner, materials | USD (constant 2017) | 1995-2022 |
| SeriesExportsServ | Exports from actor to partner, services | USD (constant 2017) | 2000-2023 |
| SeriesImportsServ | Imports by actor from partner, services | USD (constant 2017) | 2000-2023 |
| SeriesWtTariffGoods | Trade weighted tariff partner imposed on importing from actor in all goods (no services) | Percentage | 1995-2022 |
| SeriesWtTariffEner | Trade weighted tariff partner imposed on importing from actor in energy | Percentage | 1995-2022 |
| SeriesWtTariffAgri | Trade weighted tariff partner imposed on importing from actor in agriculture | Percentage | 1995-2022 |
| SeriesWtTariffMate | Trade weighted tariff partner imposed on importing from actor in materials | Percentage | 1995-2022 |
| SeriesWtTariffManu | Trade weighted tariff partner imposed on importing from actor in manufacturing | Percentage | 1995-2022 |
| SeriesWtTariffICT | Trade weighted tariff partner imposed on importing from actor in ICT | Percentage | 1995-2022 |
| SeriesTariffRevGoods | Tariff revenue received by partner importing from actor in all goods (no serivces) | USD (constant 2017) | 1995-2022 |
| SeriesTariffRevAgri | Tariff revenue received by partner importing from actor in agri | USD (constant 2017) | 1995-2022 |
| SeriesTariffRevMate | Tariff revenue received by partner importing from actor in mate | USD (constant 2017) | 1995-2022 |
| SeriesTariffRevManu | Tariff revenue received by partner importing from actor in manu | USD (constant 2017) | 1995-2022 |
| SeriesTariffRevICT | Tariff revenue received by partner importing from actor in ICT | USD (constant 2017) | 1995-2022 |
| SeriesTariffRevEner | Tariff revenue received by partner importing from actor in ener | USD (constant 2017) | 1995-2022 |
| SeriesImportsGoods | Imports by actor from partner, all goods (no services) | USD (constant 2017) | 1995-2022 |
| SeriesExportsGoods | Exports from actor to partner, all goods (no services) | USD (constant 2017) | 1995-2022 |
| SeriesTCIAgri | Trade complementarity between actor's exports and partner's imports in agri | Index | 1995-2022 |
| SeriesTCIEner | Trade complementarity between actor's exports and partner's imports in ener | Index | 1995-2022 |
| SeriesTCIMate | Trade complementarity between actor's exports and partner's imports in mate | Index | 1995-2022 |
| SeriesTCIManu | Trade complementarity between actor's exports and partner's imports in manu | Index | 1995-2022 |
| SeriesTCIICT | Trade complementarity between actor's exports and partner's imports in ICT | Index | 1995-2022 |
| SeriesTCIGoods | Trade complementarity between actor's exports and partner's imports in all goods (no services) | Index | 1995-2022 |


