India's Education Data
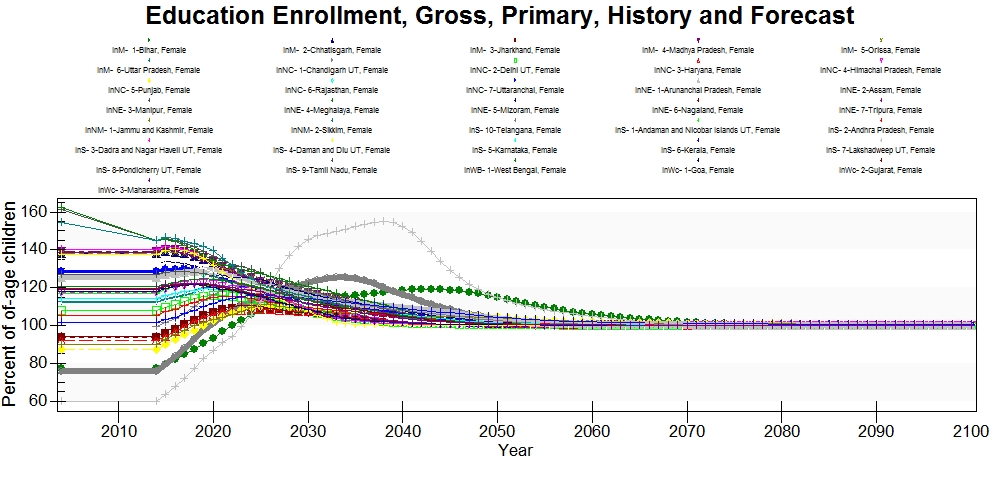
EdPriEnrollGrossFemalePcnt
Primary gross enrollment of female students was found in the Ministry of Human Resource Development, Government of India, Annual Report. The data has not been verified from prevous model versions and the original source was insufficiently cited and has not been found again. The series has data for only 2004 and needs updated.
Gross enrollments for females are over 100% in most of India's states. Lakshadweep has the lowest gross enrollment which is forecast to increase rapidly and then decline after students get on grade level.
This series could be updated using data that is available from the Ministry of Planning with data from 2011 and there may be more recent data available with further research.
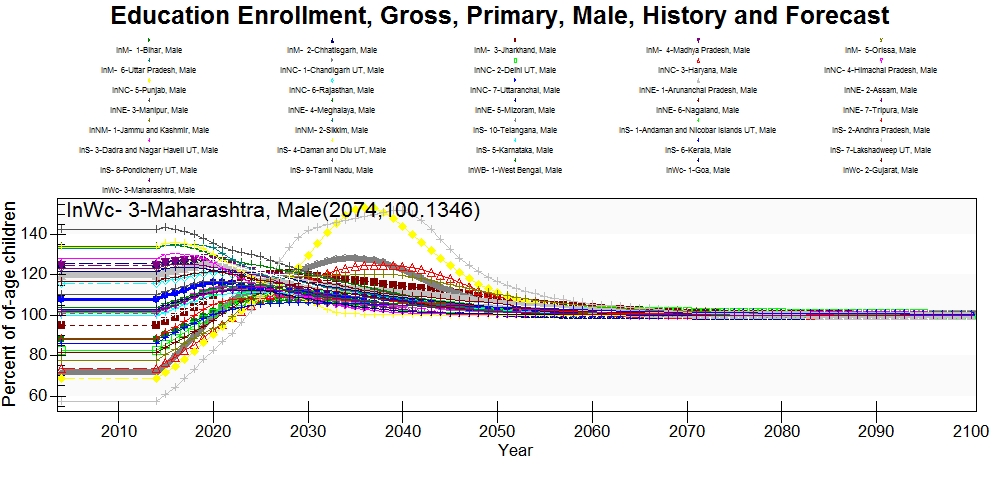
EdPriEnrollGrossMalePcnt
Primary gross enrollment of male students was found in the Ministry of Human Resource Development, Government of India, Annual Report. The data has not been verified from prevous model versions and the original source has not been found. The series has data for only 2004 and the series needs updated.
Male gross enrollment rates are higher than the female gross enrollment rates overall. About half of the states have enrollments over 100% which are forecast to decline to 100% at around 2030. Lakshadweep has the lowest gross enrollment rate which is forecast to increase to over 100% and then declines back down to 100% by around 2055.
This series can be updated with data from the Ministry of Planning in a report on education in 2011. There may be more recent data to update this series with, but further research is needed.
EdPriEnrollGrossTotalPcnt
Primary gross enrollment of all students was found in the Ministry of Human Resource Development, Government of India, Annual Report. The data has not been verified from prevous model versions and the original source has not been found. The series has data for only 2004 and needs updated.
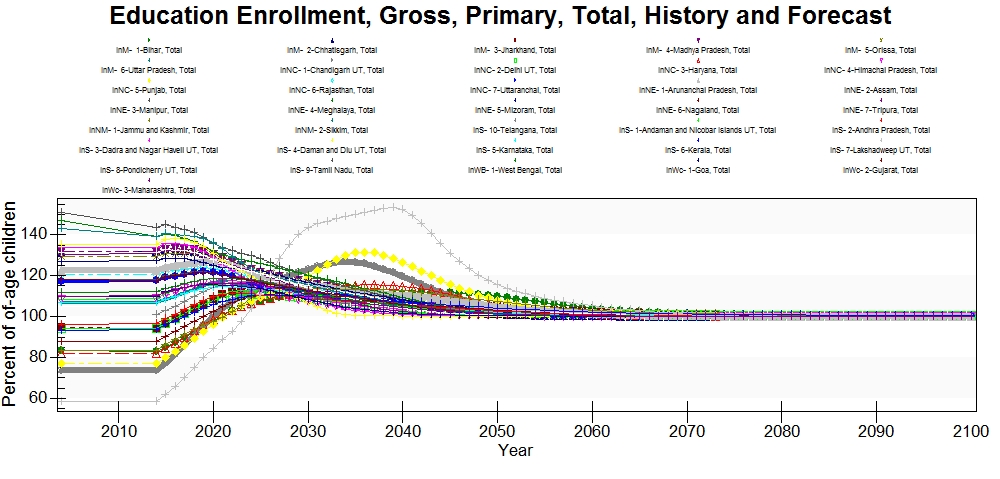 The model behavior for the total primary education gross enrollment looks good because all states smoothly approach 100% enrollments. States that have a low starting point increase to well above 100% as students that are behind in their education catch up. This occurs most notably in Lakshadweep, which starts at about 60% total enrollments.
This series could be updated with data that is available from the Ministry of Planning that has a report of education enrollment in 2011. There may be a more recent report available to update this series with, but it has not be located.
EdPriEnrollNetTotalPcnt
This series was found in a Human Development Report of India and has data for 1981 and 1991.
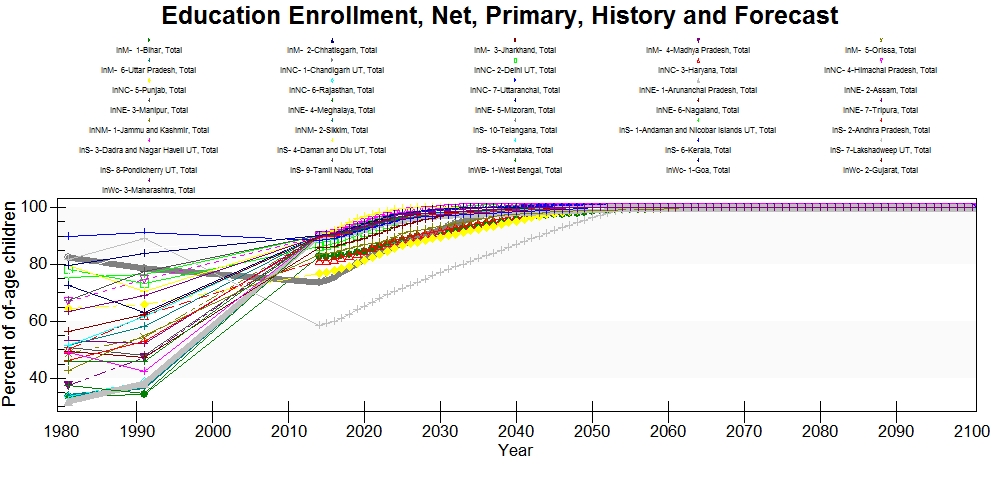 Most states look fine and steadily increase to 100% net enrollment. However, Lakshadweep has a major transient where the historical data has the union territory over 80% net enrollment rates and then at model initialization in 2014 the net enrollments drop down to 60%. The historical data looks incorrect for Lakshadweep because the gross enrollment rates are around 60%, which would suggest that the net enrollments should be below 60%. The forecasts look reasonable despite this historical inaccuracy, but future users should update this series and use new data. It would be preferrable for future users to use the same source for net and gross enrollments to prevent this sort of historical transients in the model.
This series could be updated using a more recent Ministry of Human Resource Development, Government of India, Annual Report or from the DevInfo database in the MDG data.
EDPriPTR
Student teacher ratios in primary education was found in a Human Development Report of India and has data for 1982, 1992, and 1997.
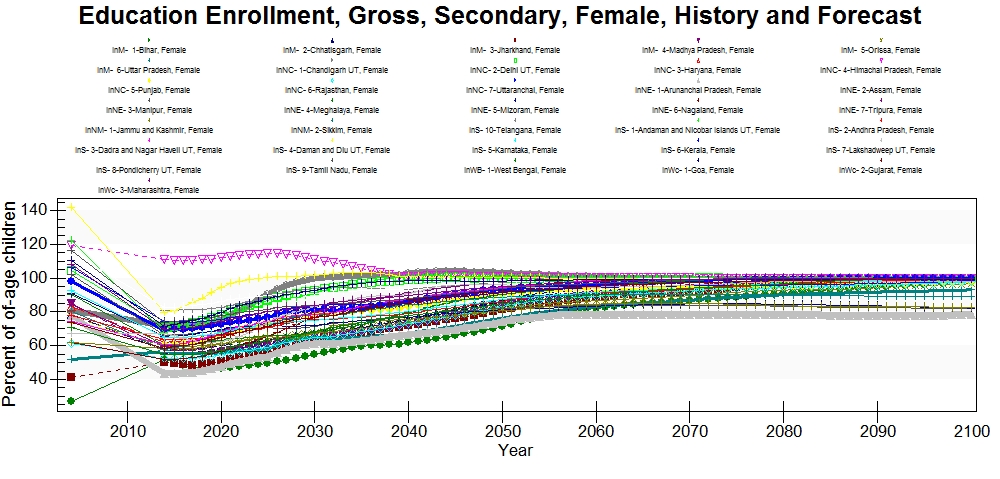
EdSecEnrollGross%Female
Secondary gross enrollment of female students was found in a Ministry of Human Resource Development, Government of India, Annual Report. The data has not been verified from previous model versions and the original data source has not been found. There is data for only 2004 and could use an update.
The highest historical secondary education enrollment for females is in Daman and Diu. This union territory drops by nearly 50% in the first year of forecasts in 2014, which is concerning. This drop between the historical data and the forecasts occurs in most states and is generally of a greater magnitude in states with higher historical gross enrollment rates. It is also surprising that the union territory Lakshadweep that had the lowest primary gross enrollments, is in the middle historically and in the forecasts in secondary gross enrollments.
EdSecEnrollGross%Male
Secondary gross enrollment of male students was found in a Ministry of Human Resource Development, Government of India, Annual Report. The data has not been verifiend from previous model versions and the original data source has not been found. There is data for only 2004.
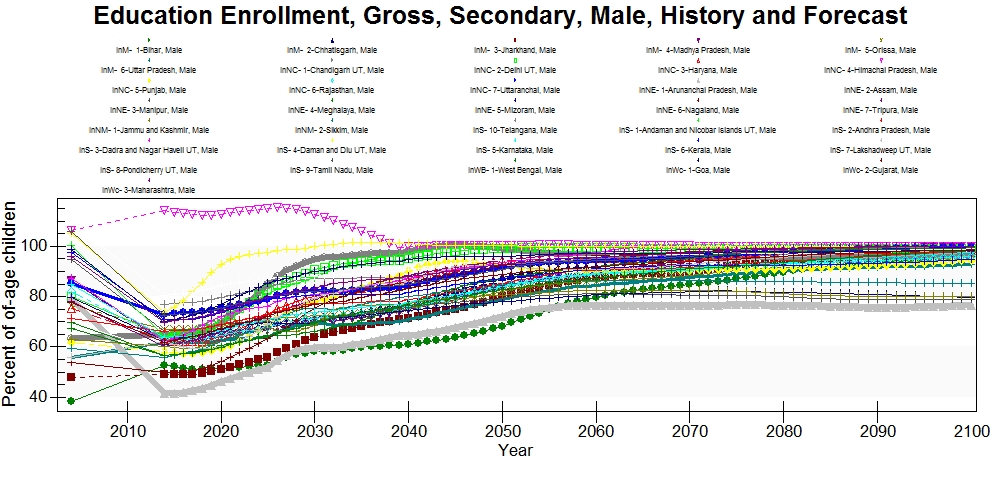 Like the female secondary gross enrollments there is a significant drop in many states between the historical data and the forecasts. The most significant drop is in Aruchanal Pradesh which decreases by nearly 50%. Lakshadweep is ranked in the middle which is surprising because the union territory has the lowest primary gross enrollment rates historically.
EdSecEnrollGross%Total
Secondary gross enrollment of all students was found in a Ministry of Human Resource Development, Government of India, Annual Report. The data has not been verifiend from previous model versions and the original data source has not been found. There is data for only 2004.
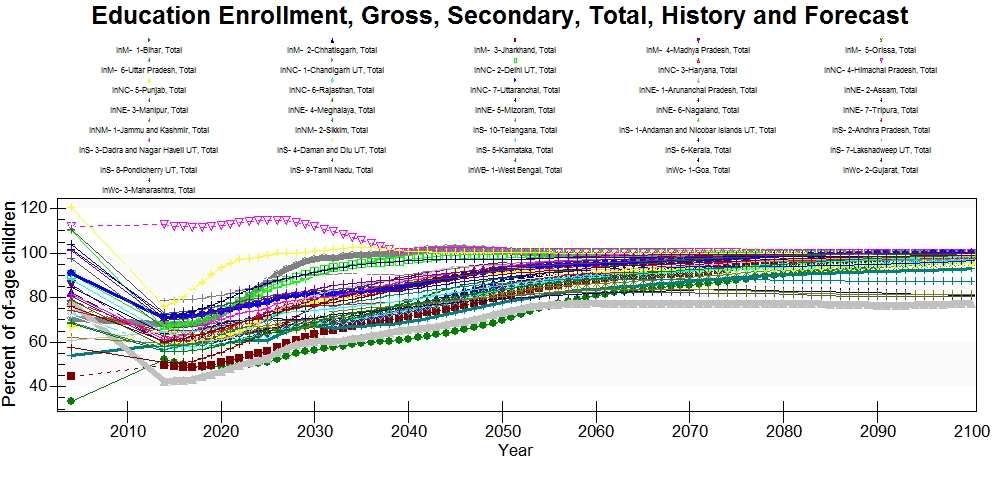 Himachal Pradesh has the second highest secondary gross enrollment rate historically and it is forecast to be the highest through the end of the time horizon, although it will steadily decline to 100% around 2040. The significant drop between the historical data and the beginning of the forecasts in 2014 is consistent with what occurs in the female and male rates.
EdSecEnrollNet
Secondary net enrollment of students was found in a Human Development Report of India and there is data for 1981 and 1991. This series is dated and needs an update.
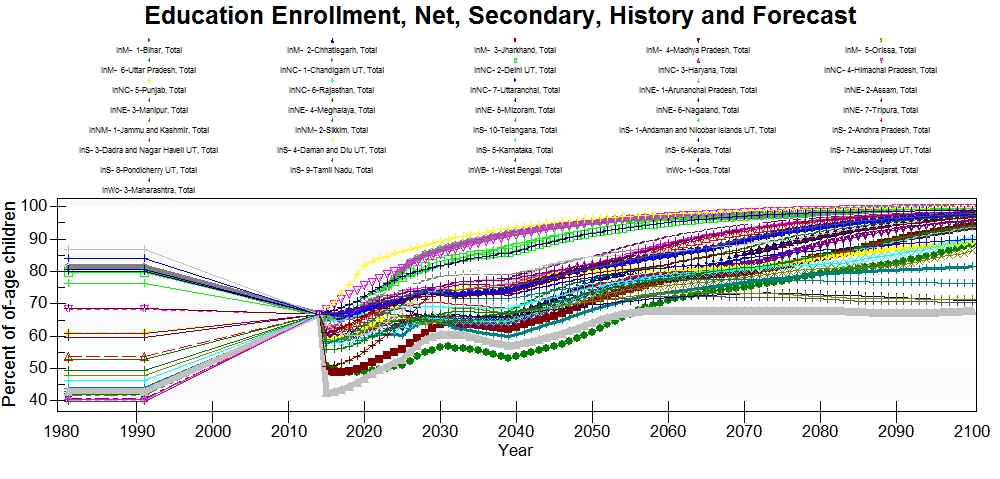 The model behavior for this series is strange where all state's net enrollments are forced to 67% when the model begins its forecasts in 2014. This model behavior is similar in China's sub-regional model, where the net enrollment rates are forced to 0% in 2014. However, this unexpected behavior does not appear to occur throughout the 186-model. Although a data update is absolutely necessary for better model performance, this issue of model behavior needs addressed directly and a data update will not remedy this issue.
EdSecUpperEnrollGross%Female
Upper secondary gross enrollment for females was found in a Ministry of Human Resource Development, Government of India, Annual Report. The data has not been verifiend from previous model versions and the original data source has not been found. There is data for only 2004.
EdSecUpperEnrollGross%Male
Upper secondary gross enrollment for males was found in a Ministry of Human Resource Development, Government of India, Annual Report. The data has not been verifiend from previous model versions and the original data source has not been found. There is data for only 2004.
EdTerEnrollGross%Female
Tertiary gross enrollment of females was found in a Draft Report of Working Group on Higher Education 11th Five Year Plan Planning Commission. This series only has data for 2000.
This series is outdated and there is more recent data available at the Ministry of Statistics and Programme Implementation website in the Statistical Yearbook of India for 2016 in the Education section.
EdTerEnrollGross%Male
Tertiary gross enrollment of males was found in a Draft Report of Working Group on Higher Education 11th Five Year Plan Planning Commission. This series only has data for 2000.
This series is outdated and there is more recent data available at the Ministry of Statistics and Programme Implementation website in the Statistical Yearbook of India for 2016 in the Education section.
EdTerEnrollGross%Total
Tertiary gross enrollment of all students was found in a Draft Report of Working Group on Higher Education 11th Five Year Plan Planning Commission. This series only has data for 2000.
This series is outdated and there is more recent data available at the Ministry of Statistics and Programme Implementation website in the Statistical Yearbook of India for 2016 in the Education section.
Illiteracy%
Illiteracy rates are calculated using the Census of India literacy rate data. The series has data for every decade starting in 1951 and ending in 2011 because the Census is done every ten years.
LiteracyAdult%
Adult literacy rates are found in the Census of India which publishes literacy data every ten years when the census is conducted, starting iin 1951 and ending in 2011.
