EconDash: Difference between revisions
No edit summary |
No edit summary |
||
| Line 298: | Line 298: | ||
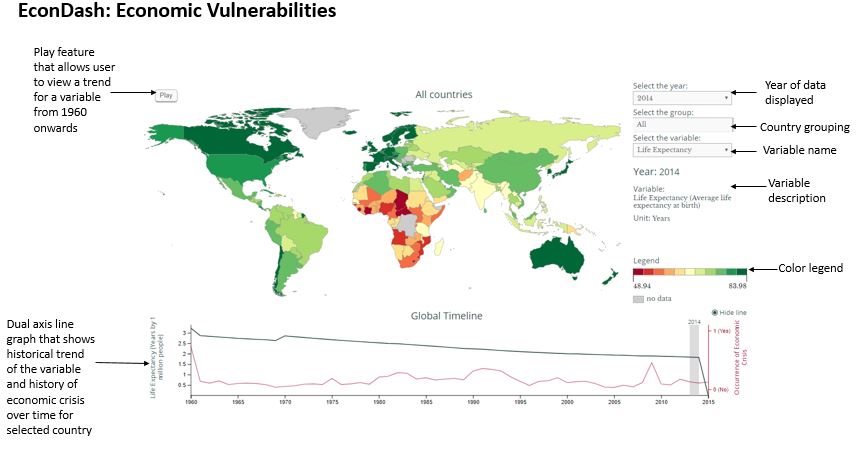
Please see the image here that shows the interface along with all its features. | Please see the image here that shows the interface along with all its features. | ||
[[File:EconDash viz 2.JPG|frame|right|upright|EconDash: Economic Vulnerabilities Interface (with description of all features)]] | == [[File:EconDash viz 2.JPG|frame|right|upright|EconDash: Economic Vulnerabilities Interface (with description of all features)]]Defining variables and groups == | ||
| Line 327: | Line 327: | ||
=== Dependent variable: Occurence of economic crises === | === Dependent variable: Occurence of economic crises === | ||
| Line 362: | Line 360: | ||
#Credit rating for the country | #Credit rating for the country | ||
#Development levels. | #Development levels. | ||
The figure below shows how the user can select specific country groups in the interface | The figure below shows how the user can select specific country groups in the interface | ||
Revision as of 22:24, 31 July 2017
The EconDash is a set of interactive data visualizations created by the Frederick S. Pardee Center for International Futures. The purpose of these visualizations is to allow the user to explore and better understand relevant indicators of financial and economic instability and resilience. EconDash uses both monadic and dyadic data across time, and includes some forecasted variables from the International Futures (IFs) system. There is currently one public user interface available from EconDash that explores Trade Networks. A new Economic Vulnerability interface will be available by late summer 2017.
EconDash: Trade Networks Interface
This dashboard focuses on trade networks from 1960 to 2014 and the centrality of countries in these networks. It also contains data on financial crises over the same time period. To access the dashboard click here.
The EconDash interface allows users to display and explore financial and economic crises and global trade networks along a variety of dimensions. Figure 1 is an

annotated view of the main display page with its default settings. It provides definitions and instructions on each of the page's functions. On this page, the user can select the independent variables that determine: 1) the size of the bubbles that represent each country ("Select country size"); 2) the bubbles' color scheme ("Select country color"); 3) the network that is represented by the links (grey lines) between countries ("Select network"); and 4) the value threshold over which network links should be displayed for the selected network variable ("Show connections"). One can also select the year of the data that will be displayed ("Select year"). Currently, data is available from 1960 to 2014. In addition, the interface provides information about the selected independent variables in the textual display on the right and in graphs at the bottom of the screen. One can access country-specific information about

selected variables by mousing over each country bubble (see Figure 2). Information about the network variable for two countries (country dyads) can be viewed by mousing over the grey line linking them (see Figure 3). Generally, the most meaningful stories emerge when two or more of the selected variables represents the same category of information. For example, one could gain a better understanding of the world's energy trade networks and how they relate to economic sophisitaction (as measured by GDP per capita) by selecting "GDPPCP" for country size, "centrality score energy" for country color, "total energy trade" for network, and experimenting with connection thresholds.
Example Exploration: Financial Crises Across Time
Say you want to better understand the occurrence and movement of financial crises across time. Select "GDP at MER" for the country

size, "Financial Crisis (Binary)" for the country color and "Total Trade" for the network. Then, select 1960 for the year, and (without clicking again) begin to scroll down though subsequent years using the down arrow key on your keyboard. In this way, you can quickly see which countries experienced a financial crisis in each year. Some patterns you may notice are:
- Between 1960 and 1980 financial crises were limited to the Global South
- After 1980, more countries in the Global North began to experience crisis, and the US had its first post-1960 crisis in 1988
- Crises occur in geographically contiguous country clusters relatively often (e.g. western South America 1981, Scandanavia 1991, Eastern Europe 1992, east and southeast Asia 1997 and 1998)
- When countries with large economies are involved in a crisis, it can affect a region and/or trading partners in subsequent years; this cascading effect can be seen in the map view and in the bar graph displayed at the bottom of the page (e.g. Asian financial crisis with Japan as the epicenter in 1996 and 1997 and the Global Financial Crisis with the US and UK as epicenters in 2007-2009)
Defining the Variables
The different categories of relevant indicators are listed below, with a justification for their inclusion in the EconDash visualization.
Dependent Variable:Types of Crises
The dependent variable is defined as an economic crisis that occurs as a result of strictly economic phenomena. This excludes economic instability resulting from political instability or natural disasters. Economic crises are classified according to the following IMF data.
The IMF Systemic Banking Crises Database was originally published in 2008 by Luc Laeven and Fabián Valencia, and updated in 2012. The IMF Systemic Banking Crises Database covers 431 crisis events identified from 1970 to 2011, of which 134 are identified as systemic banking crises, 13 borderline systemic banking crises, 218 currency crises, and 66 sovereign debt crises. For the 147 systemic or borderline systemic banking crises, the database also tracks the mixture of policy responses to each of these systemic banking crises. The authors of the database classify each of the crisis events per the following criteria:
Financial Crises
Financial crises are analyzed as binary variables from the IMF's banking crises database. They observe the occurence of any one of the following types of financial crises:
- Systemic Banking Crisis
- Currency Crisis
- Sovereign Debt Crisis
Systemic Banking Crisis
Systemic banking crises are contingent upon satisfying the following two conditions:
1) Significant signs of financial distress in the banking system (as indicated by significant bank runs, losses in the banking system, and/or bank liquidations)
2) Significant banking policy intervention measures in response to significant losses in the banking system. The first year that both conditions are satisfied is considered the onset year.
The second condition can be met when three of the following six policy intervention measures have been implemented:
- Extensive liquidity support - Liquidity support is extensive when the ratio of central bank claims on the financial sector to deposits and foreign liabilities exceeds five percent and more than doubles relative to its pre-crisis level. The authors also included any liquidity support extended directly from the treasury. But liquidity support to subsidiaries of foreign banks is not included in the ratio of the foreign country, only the domestic ratio.
- Bank restructuring gross costs - Bank restructuring costs are defined as gross fiscal outlays directed to the restructuring of the financial sector. The authors exclude liquidity assistance from the treasury captured by the first intervention to avoid potentially double counting. Bank restructuring costs are considered significant if they compose at least 3% of GDP
- Significant bank nationalizations - Significant nationalizations are takeovers by the government of systemically important financial institutions and include cases where the government takes a majority stake in the capital of those financial institutions.
- Significant guarantees put in place - Significant guarantee on bank liabilities indicate that either a full protection of liabilities has been issued or that guarantees have been extended to non-deposit liabilities of banks. However, policy interventions that only target the level of deposit insurance coverage are excluded.
- Significant asset purchases - Significant asset purchases from financial institutions by the central bank or the treasury exceeding five percent of GDP.
- Deposit freezes and/or bank holidays - Government halts acccount activity or require bank closure; this action is taken more frequently by emerging economies.
Outside of these criteria, a crisis can be deemed systemic if 1) a country’s banking system exhibits significant losses resulting in a share of nonperforming loans above 20 percent, or bank closures of at least 20 percent of banking system assets; or 2) fiscal restructuring costs of the banking sector are sufficiently high exceeding 5 percent of GDP.
Currency Crisis
Currency crises occur when the national currency experiences a nominal depreciation of the currency against the U.S. dollar of at least 30 percent and is also at least 10 percentage points greater than the rate of depreciation in the year before. The authors use the bilateral dollar exchange rate from the World Economic Outlook database from the IMF. In cases where countries meet the currency criteria for several continuous years, the authors use the first year of each 5-year window to identify the crisis. Using this approach the authors identify 218 currency crises from 1970 to 2011, of which, 10 occur from 2008 to 2011.
Sovereign Debt Crisis and Debt Restructuring Years
Sovereign debt crises occur when countries default on their sovereign debt to private creditors. The authors identify 66 sovereign debt crises using data taken from a Beim and Calomiris 2001 paper, the World Bank, a Sturzenegger and Zettelmeyer 2006 paper, IMF staff reports, and reports from rating agencies. Similarly, the year of debt restructuring is the year a country restructures their debt. It is possible to have multiple crises and debt restructurings in a single year, see Greece 2012. [1]
Independent Variable: Drivers of Crises
The independent variables in this dataset describe countries' internal economic conditions and their networked relationships, i.e. centrality scores. Table 1 lists each independent variable and provides its category, source, and definition. See additional information on data sources below.
Table 1: Variable List
| Variable Name | Source Institution(s) | Source Database(s) | Definition |
| Structural Variables | |||
| GDP Growth Rate | Pardee Center & International Monetary Fund (IMF) | International Futures (IFs) & IMF's World Economic Outlook (WEO) | Gross domestic product (GDP) growth rate, percent |
| GDP at MER | Pardee Center & IMF | IFs & WEO | GDP at Market Exchange Rates (billion USD), 2011 constant prices |
| GDPPCP | Pardee Center & IMF | IFs & WEO | GDP per capita at Purchasing Power Parity (PPP) (thousand USD), 2011 constant prices |
| Financial Variables | |||
| Centrality Score Ag | Pardee Center, United Nations Trade Statistics (UNTS) & CEPii | UN Comtrade Database (Comtrade) & CEPii's BACI |
Centrality of country in the agricultural trade network meausured as aggregate trade in millions of USD |
| Centrality Score Ag (Percent) | Pardee Center, UNTS, & CEPii |
Comtrade & BACI | Centrality of country in the agricultural trade network measured as a percent of a country's GDP |
| Centrality Score Energy |
Pardee Center, UNTS, & CEPii |
Comtrade & BACI | Centrality of country in the energy trade networkmeasured as aggregate trade in millions of USD |
| Centrality Score Energy (Percent) | Pardee Center, UNTS, & CEPii |
Comtrade & BACI | Centrality of country in the energy trade network measured as a percent of a country's GDP |
| Centrality Score ICT | Pardee Center, UNTS, & CEPii | Comtrade & BACI | Centrality of country in the ICT trade network measured as aggregate trade in millions of USD |
| Centrality Score ICT (Percent) | Pardee Center, UNTS, & CEPii |
Comtrade & BACI | Centrality of country in the energy trade network measured as a percent of a country's GDP |
| Centrality Score Manufacturing | Pardee Center, UNTS, & CEPii | Comtrade & BACI |
Centrality of country in the manufacturing trade network measured as aggregate trade in millions of USD |
| Centrality Score Manufacturing (Percent) | Pardee Center, UNTS, & CEPii |
Comtrade & BACI | Centrality of country in the manufacturing trade network measured as a percent of a country's GDP |
| Centrality Score Materials | Pardee Center, UNTS, & CEPii |
Comtrade & BACI |
Centrality of country in the materials trade network measured as aggregate trade in millions of USD |
| Centrality Score Materials (Percent) | Pardee Center, UNTS, & CEPii | Comtrade & BACI |
Centrality of country in the materials trade network measured as a percent of a country's GDP |
| Centrality Score Services | Pardee Center & UNTS | Comtrade & UN Service Trade Statistics Database |
Centrality of country in the services trade network measured as aggregate trade in millions of USD |
| Centrality Score Services (Percent) | Pardee Center & UNTS |
Comtrade & UN Service Trade Statistics Database |
Centrality of country in the services trade network measured as a percent of a country's GDP |
| Centrality Score Total | Pardee Center, UNTS, & CEPii |
Comtrade, BACI, & UN Service Trade Statistics Database |
Centrality of country in the total trade network measured as aggregate trade in millions of USD |
| Centrality Score Total (Percent) |
Pardee Center, UNTS, & CEPii |
Comtrade, BACI, & UN Service Trade Statistics Database |
Centrality of country in the total trade network measured as a percent of a country's GDP |
| Network Variables | |||
| Total Trade as a Percent of GDP | Pardee Center, UNTS, & CEPii |
Comtrade, BACI, & UN Service Trade Statistics Database |
Total trade as a percent of the partner country's GDP |
| Total Energy Trade | Pardee Center, UNTS, & CEPii |
Comtrade & BACI |
Total bilateral energy trade in millions of USD |
| Total ICT Trade | Pardee Center, UNTS, & CEPii |
Comtrade & BACI |
Total bilateral ICT trade in millions of USD |
| Total Manufacturing Trade | Pardee Center, UNTS, & CEPii |
Comtrade & BACI |
Total bilateral manufacturing trade in millions of USD |
| Total Materials Trade | Pardee Center, UNTS, & CEPii |
Comtrade & BACI |
Total bilateral materials trade in millions of USD |
| Total Services Trade | Pardee Center & UNTS |
Comtrade & UN Service Trade Statistics Database |
Total bilateral services trade in millions of USD |
| Total Agricultural Trade | Pardee Center, UNTS, & CEPii |
Comtrade & BACI |
Total bilateral agricultural trade in millions of USD |
| Total Trade | Pardee Center, UNTS, & CEPii |
Comtrade & BACI |
Total bilateral trade in millions of USD |
| Total Energy Trade as a Percent of GDP | Pardee Center, UNTS, & CEPii |
Comtrade & BACI |
Total energy trade as a percent of the partner country's GDP |
| Total ICT Trade as a Percent of GDP |
Pardee Center, UNTS, & CEPii |
Comtrade & BACI |
Total ICT trade as a percent of the partner country's GDP |
| Total Manufacturing Trade as a Percent of GDP |
Pardee Center, UNTS, & CEPii |
Comtrade & BACI |
Total manufacturing trade as a percent of the partner country's GDP |
| Total Materials Trade as a Percent of GDP |
Pardee Center, UNTS, & CEPii |
Comtrade & BACI |
Total materials trade as a percent of the partner country's GDP |
| Total Services Trade as a Percent of GDP |
Pardee Center & UNTS |
Comtrade & UN Service Trade Statistics Database |
Total services trade as a percent of the partner country's GDP |
| Total Agricultural Trade as a Percent of GDP |
Pardee Center, UNTS, & CEPii |
Comtrade & BACI |
Total agricultural trade as a percent of the partner country's GDP |
Data Sources
Most dyadic trade data comes from the UN Comtrade Database, which houses the world's "official international trade statistics." CEPii cleans the Comtrade data, so data has been pulled from its BACI Database for ease of use. However, CEPii does not have dyadic trade data for the services sector, so data from the UN Service Trade Statistics Database is blended with the CEPii data to get a complete trade balance. Both Comtrade and the Service Trade Statistics databases are managed by the UN Trade Statistics branch of the United Nations Statistics Division.
Centrality Scores
Network analysis can be used to determine a country's centrality within a global network. In network analysis, centrality has been defined along the following dimensions:
- Reach - ability of an entity to reach other vertices
- Flow - quantity/weight of passing through entity
- Vitality - Effect of removing entity from the network
- Feedback - A recursive function of alter centralities[2]
EconDash uses eigenvector centrality to determine the centrality of each country, or "node," in a global network. Eigenvector centrality assigns each node a relative score based on the centrality of its connections. Connections to higher-scoring nodes contribute more to a node's centrality score than connections to lower-scoring nodes. It uses a matrix calculation to iteratively determine each node's centrality score. The basic idea behind eigenvector centrality is that a central actor is connected to other central actors. It is distinct from the simpler degree centrality in that it weights connections rather than assigning a score based on the number of connections alone.[3] In Trade Networks visualization, eigenvector centrality is used to analyze centrality of a country in a trade network in a particular year.
Data Structure
Monadic Data
Monadic data are those that describe one country in a single year with a structure of country-year. For example, Senegal's GDP per capita at PPP in 2012. In the EconDash's Trade Networks visualization, monadic variables include all Dependent Variables (i.e. crises), Structural Variables (i.e. economic statistics) and Financial Variables (i.e.centrality scores). While centrality scores are calculated based on a country's trade relationships with other countries (nodes) in the global network, countries receive a single, annual centrality score for each trade sector.
Dyadic Data
Dyadic data are those that describe the relationship between two countries in a single year with a structure of country-country-year. For example, total ICT trade between the US and China in 2015. In the EconDash's Trade Networks visualization, dyadic variables include all Network Variables (i.e. abosolute and relative levels of trade). The dyadic trade data is used to analyze bilateral trade levels between countries in the following sectors. Each sector is analyzed as percent of partner country's GDP as well as total intrasector trade in millions of US dollars:
- Energy
- Manufacturing
- Information and Communication Technology (ICT)
- Materials
- Services
- Agriculture
- Total Trade
EconDash: Economic Vulnerabilities
This dashboard focuses on economic vulnerabilities across countries across time. This dashboard is based on monadic independent variables from 1960 to 2015 and a binary dependent variable namely the occurrence of economic crises. This visualization also includes groups of the independent variables along with groups of countries developed on the basis of specific criteria. To access the dashboard click here.
The interface enables the user to view and analyze various independent variables across countries across time. The dashboard presents a world map populated with a relevant variable in a particular year. The variable is color scaled and a “valence” has been defined for each variable. For example, the demographic dividend moves from red to green (lowest to highest), whereas infant mortality moves from green to red (lowest value to highest value). There are three filters at the top right of the visualization that allow the user to select a relevant year, a relevant variable or indicator and a particular country group. The dashboard allows the user to play a particular variable over time so that the unfolding trend can be analyzed visually across countries.
Below the map visualization, the user can see a line/bar graph describing the trend of the variable for the world as a whole over time. When a user hovers over a particular country, this line/bar graph describes the trend for the country instead of the world as a whole over time. Also note that this graph will show the trend over the entire time horizon even when the filter above is set to a particular year. This enables the user to understand the overall trend before selecting a particular country.
Under the line graph, the user can see what group a particular variable belongs to. For example, the variable demographic dividend belongs to the group ‘Demographic Vulnerabilities’.
Finally, in order to better understand vulnerability to crises, the dashboard helps the user analyze the same not just across countries but also across “groups” of countries. The basis of these groups include factors such as income levels, development levels, geographic region, exchange rate regime etc. The filter above the map visualization has an option for selection of country groups. This enables the user to see a cluster of countries and the variables for the same.
Please see the image here that shows the interface along with all its features.
 EconDash: Economic Vulnerabilities Interface (with description of all features)Defining variables and groups

Dependent variable: Occurence of economic crises
The dependent variable (DV) was for the purpose of the second visualization was calculated on the basis of the percent change in the GDP at MER. The following steps were followed in the computation of the DV,
First, the percent change in GDP at MER was calculated from 1960 onwards using historical data and forecasts from IFs. Three thresholds were set for the DV, namely, where the change in the growth rate was lesser than -4%, a second threshold where the GDP growth rate was lesser than -1% and one where the percent change in GDP growth rates was less than 0%. Three binary variables were computed i.e. the value in a particular year for a particular country was set to 1 where an economic crisis was said to occur, if these three thresholds were met.
The variable “Occurrence of Economic Crisis” that appears in the visualization is a combination of these three dependent variables.
Independent variables
This display allows the user to view 75 independent variables in addition to the dependent variable (described above) across countries and across time. All the variables have been grouped into seven main categories, namely,
- The Dependent variable (This is the occurrence of economic crisis that has been described above)
- Economic input dependencies and vulnerabilities (This group includes variables such as Raw material imports, Food imports etc.)
- Financial vulnerabilities (This group includes variables such as the average exchange rate, the balance of payments, capital account balance etc.)
- Environmental vulnerabilities (This group includes variables such as the number of displacements on account of natural disasters, carbon emissions, precipitation change etc.)
- Political vulnerabilities (This group includes variables such as polity scores, the occurrence of events of political instability etc.)
- Demographic vulnerabilities (This group includes variables such as the population, youth bulge, dependency ratios etc.)
- Economic output dependencies and vulnerabilities (This group includes variables such as Exports, export diversification, GDP, GDP per capita etc.)
Country grouping function
To better understand what drives economic crises, the visualization also gives the user the option to view the occurrence of crises across groups of countries in addition to individual countries. These groups were developed using specific criteria such as fuel imports, exchange rate regimes, levels of development etc. The user can currently select from up to 8 groups of countries with various sub-groups. The main groups are,
- Levels of corruption
- Ease of doing business
- Fuel exports
- Income levels
- Currency regimes
- Anchor currency in the economy
- Credit rating for the country
- Development levels.
The figure below shows how the user can select specific country groups in the interface

References
- ↑ Luc Laeven and Fabian Valencia. "Systemic Banking Crises Database: An Update," IMF Working Paper 12 (2012): 1-32. Accessed July 6, 2017. https://www.imf.org/~/media/Websites/IMF/imported-full-text-pdf/external/pubs/ft/wp/2012/_wp12163.ashx.
- ↑ Peter Hoff. "Centrality: Statistical Analysis of social networks." (n.d). Retrieved July 6, 2017, from http://www.stat.washington.edu/people/pdhoff/courses/567/Notes/l6_centrality_paused.pdf.
- ↑ "Eigenvector Centrality." (n.d.). Retrieved July 6, 2017, from https://www.sci.unich.it/~francesc/teaching/network/eigenvector.html.