Economy
Development Profile
The Development Profile display can be reached from the Display option of the Main Menu, under Specialized Displays for Issues sub-option and Development Profile sub-sub-option. It is also located under the Main Menu Map Pop-up options.

The purpose of the Development Profile display feature is to track how Human Capital, Social Capital, Physical Capital and Knowledge contribute to the annual growth of a country/region or a group. For purposes of development, it is helpful to understand what aspects of a country/region or group are helping or harming the growth of a country/region or group.
The left column represents different variables calculated by IFs organized into categories. The Computed Value column represents the actual numbers calculated for the year your have selected (top right scroll-down list). These values are then used to calculate the Expected Value Predicted from GDP (Gross Domestic Product) per Capita at PPP (Purchasing Power Parity). A Standard Error is then displayed, followed by a Standard Error of the Value from the Prediction. The final two values display how the categories contributed to annual growth (displayed as a percentage) and how their contribution can be displayed as a parameter.
There are three scroll-down lists at the top of the Development Profile screen. You can choose between countries (if that has been chosen from the Main Menu) or global groups (if that has been chosen from the Main Menu). Scroll down to India in order to learn more about how to use this feature of IFs. To the right of the country/region or group scroll-down list, you can choose what year you would like display. You can then choose which Run-Result-File you would like to see displayed.
If you left-click on any of the variables displayed on the left, you will be presented with a graph that shows the Computed Value of that variable for the year you have selected, as well as a logarithmic graph of GDP at PPP compared to the variable you are interested in.
Select one variable that you would like to see forecast over time. Click on the number displayed in the Computed Value column, and a chart will appear that displays this variable for each year computed in your version of IFs and for each Run-Result-File that you are using. At the top of this chart you have a number of options for displaying this information. You may visually represent this information through a line graph or a bar graph, save the information, add or design a filter, rank the information by selected year, compute the percentage that each column represents of the total across all using the Pct of Tot. Options (percent of total options), choose from several comparison options, or set the time horizon for your information. Under Display Options, you may toggle between whole number representation or representation as a percentage change across time from the base year , toggle between displaying results as cumulative totals, discount, or cumulative with discount, turn the interval average on or off, select a moving average, a conversion unit, change the display interval, or set the value for the base year as 1 to convert a variable into an index by selecting Index Base One.
Social Accounting Matrix
The Social Accounting Matrix can be reached from the Display option on the Main Menu, under Specialized Displays for Issues. It is also located under the Main Menu Map Pop-up options.
A social accounting matrix (SAM) is an extension of an input-output table that economists use to show the inter-sectoral flows of goods and services within an economy. The SAM more generally displays flows among actor-classes in the socio-economic system. For instance, the cell in the government column and household row shows flows from the government to households (such as pension payments). You can move across countries/regions or groupingsand across years with the drop-down boxes. You can left-click on certain numbers on the SAM table and this will bring up a small window. From this window you can expand the contents of that cell, show the variable over time in a table, or explain the cell's contents. Alternatively, the entire matrix can be expanded by selecting the Expand SAM option under Switch. This option will disaggregate each cell of the accounting matrix into its component parts. For example, the row and column of Sectors will be disaggregated to Agriculture, Energy, Materials, Manufactures, Services, and ICTech.

Note: When toggling between stocks and flows, users may note that some of the stocks are not present. This is because this feature of IFs is not fully developed, in part because stock data is much less often reported in standard sources than are flow data.
World Bank Financial Flows
The World Bank Financial Flows sub-sub-option can be reached from the Display option on the Main Menu, the Specialized Displays for Issues sub-option and then the World Bank Financial Flows sub-sub-option. It is also located under the Menu Map Pop-up options.
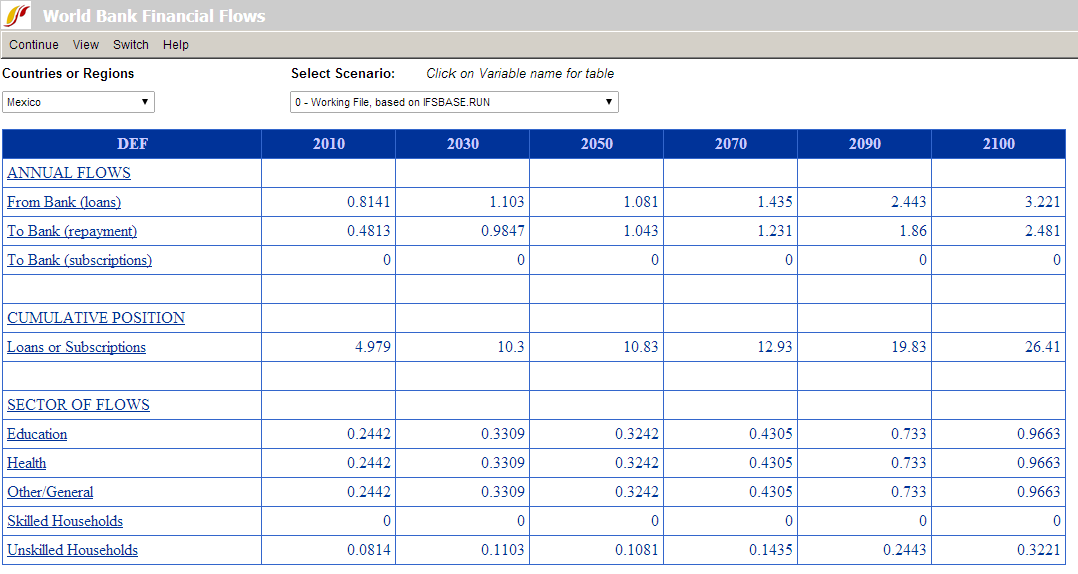
A left-click on any variable name will call up a table of data for that variable. The menu options of the table provide a number of options for displaying this information including the creation of a graph.
Use the drop-down boxes to change country/regions or the scenario file. The Switch option allows you to toggle between a list of groups and a list of countries/regions to select for your geographic option.
See if you can create a graph that will forecast Mexico's payment to the World Bank over a number of years in the future. Your results will depend heavily on what version of IFs you are using. Click on whatever variable you choose to show over time. This will present you with a table that will allow you to display the information in a number of different ways.