Health Data
CBR
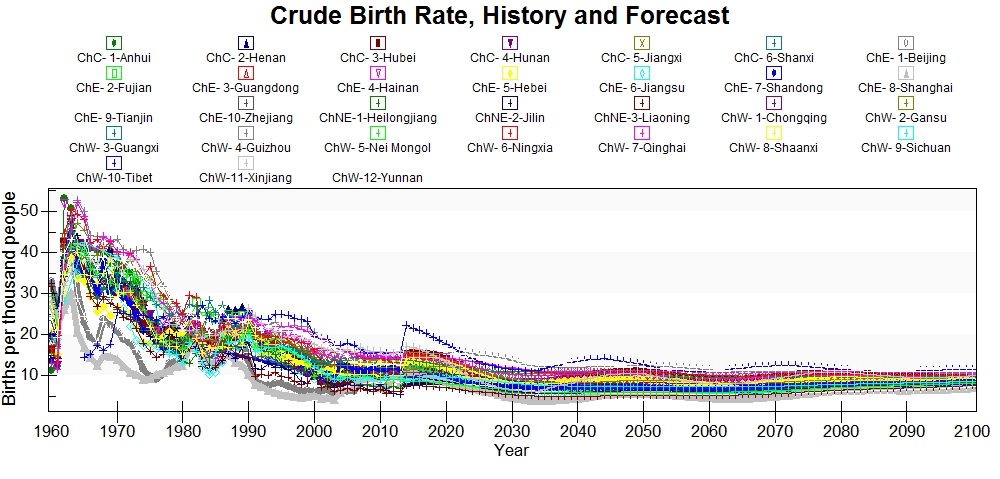
Crude Birth Rates for China's subregional model came from two series that were blended together. The data from 1949 through 2003 came from the China Data Center database. The data from 2003 through 2015 came from the China Statistical Yearbooks 2005-2016. The two series blend well and appear to be from the same original source.
There is a jump up from the historical data to the first year of forecast. Tibet is a transient with the largest jump upward in 2014.
CDR
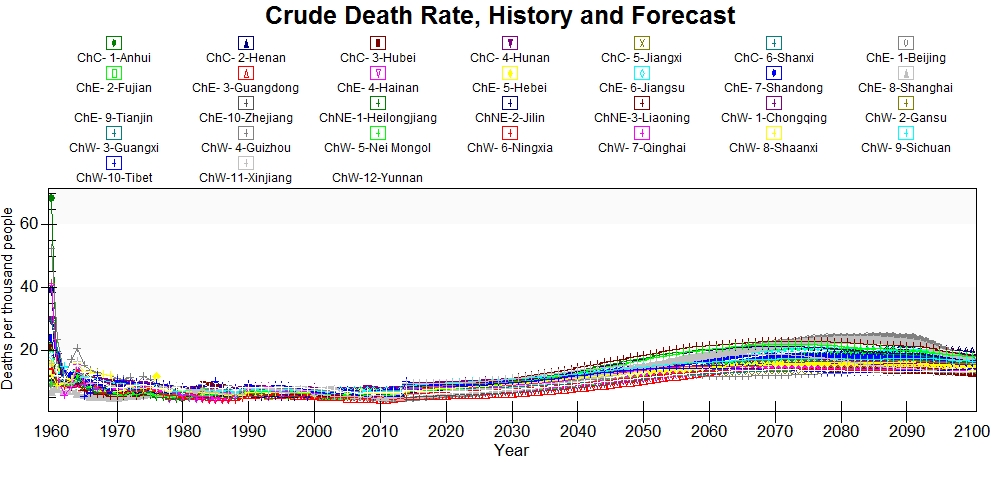
Crude Death Rates for China's subregional model came from two series that were blended together. The data from 1949 through 2003 came from the China Data Center database. The data from 2003 through 2015 came from the China Statistical Yearbooks 2005-2016. The two series blend well and appear to be from the same original source.
The peak in 1960 looks like a data error, but it is historically accurate. 1960 was the peak of the Great Leap Forward and millions of Chinese died between 1958 and 1962. Anhui province is the worst affected in 1960.
InfMortMedUNPD
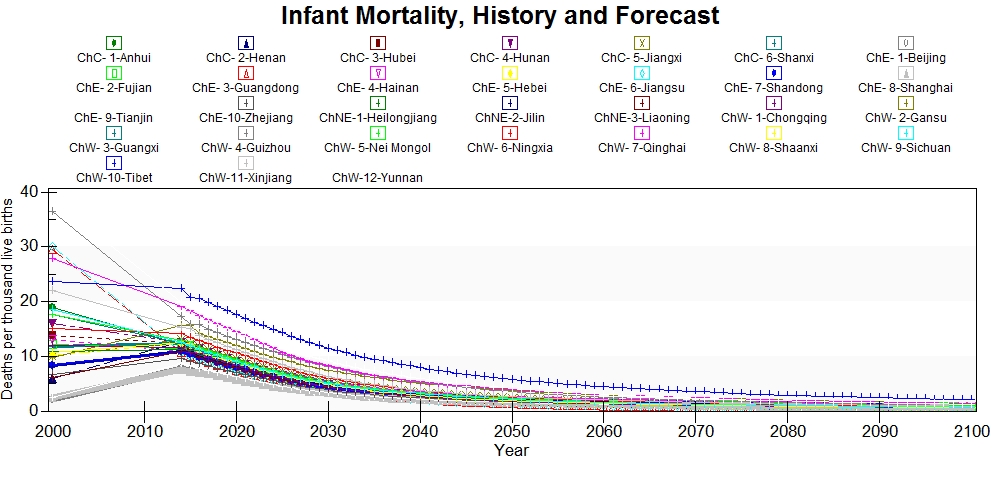
Infant mortality rates were calculated using male and female infant mortality rates from National Bureau of Statistics of China. The male and female infant mortality rates were averaged to generate a provincial infant mortality rate. There is only one observation for each province in 2000, making this series dated. This should be treated as a place holder until a source with actual infant mortality data with a more recent data is available.
LifeExpectFemale
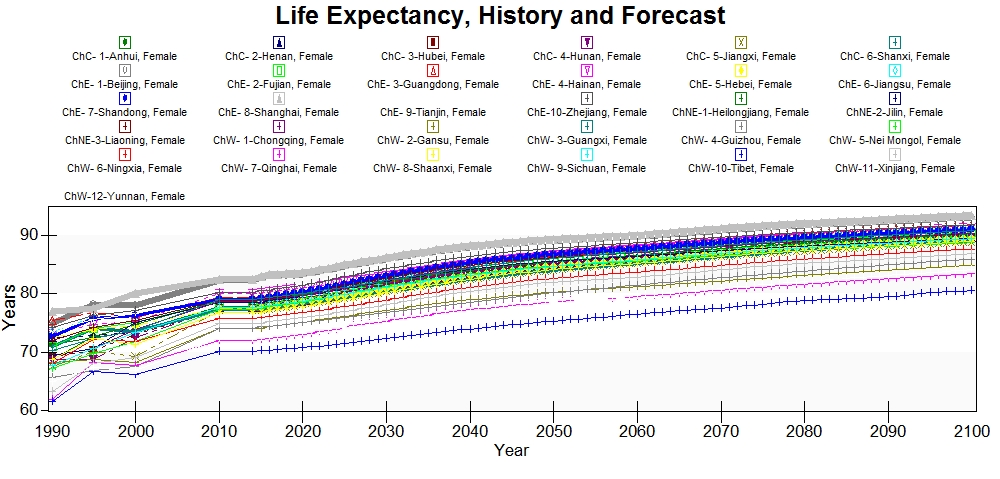
Female life expectancy was found in a Human Development Report and there is data for 1990, 1995, 2000, and 2010. A more recent observation is desired, but it does not appear to exist.
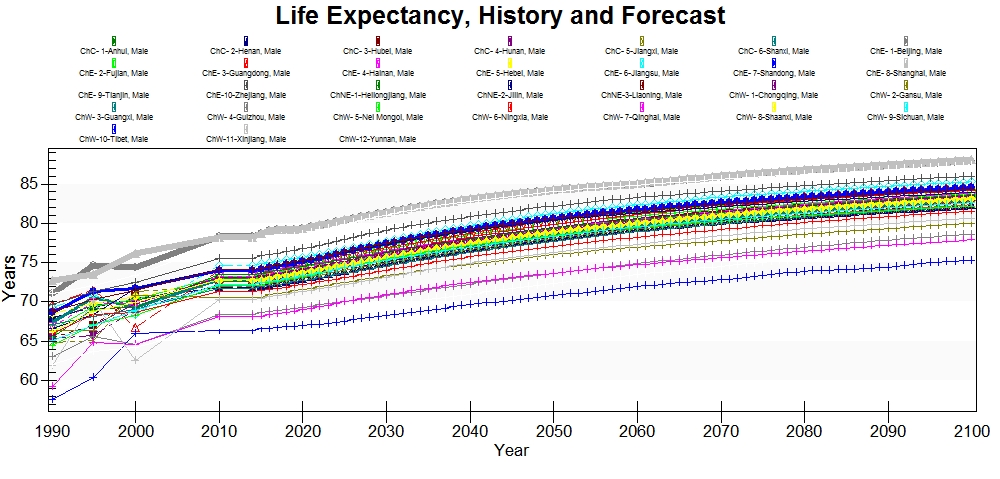
LifeExpectMale
Male life expectancy was found in a Human Development Report and there is data for 1990, 1995, 2000, and 2010. A more recent observation is desired, but it does not appear to exist.
