Health and Mortality: Difference between revisions
CamrynDreyer (talk | contribs) No edit summary |
No edit summary |
||
| Line 5: | Line 5: | ||
The Mortality by Age, Sex, and Cause option shows the distribution by age and sex of deaths per 1000 people. From this display form, users can choose to look at the forecasted results of mortality for any countries or groups in the IFs model. | The Mortality by Age, Sex, and Cause option shows the distribution by age and sex of deaths per 1000 people. From this display form, users can choose to look at the forecasted results of mortality for any countries or groups in the IFs model. | ||
[[File:Useifs17.PNG|center| | [[File:Useifs17.PNG|frame|center|Example of Age, Gender, and Type Distribution of Mortality]] | ||
The default country for viewing is Afghanistan unless you have previously clicked on a country from the map of the Main Menu Window (doing so makes the country selected the default for subsequent use of specialized displays ). You can change the country displayed by clicking the Change Display option on the form's menu. Under Change Display are sub-options that allow users to change the year or, the country/region that is being shown. If you would like to change to displaying groups, simply click the Set Group or Country/Region option located on this specialized display's menu. | The default country for viewing is Afghanistan unless you have previously clicked on a country from the map of the Main Menu Window (doing so makes the country selected the default for subsequent use of specialized displays ). You can change the country displayed by clicking the Change Display option on the form's menu. Under Change Display are sub-options that allow users to change the year or, the country/region that is being shown. If you would like to change to displaying groups, simply click the Set Group or Country/Region option located on this specialized display's menu. | ||
| Line 19: | Line 19: | ||
The Mortality Display: J-Curve sub-option is located under the Specialized Displays for Issues option, located in turn under Display from the main IFs screen. | The Mortality Display: J-Curve sub-option is located under the Specialized Displays for Issues option, located in turn under Display from the main IFs screen. | ||
[[File:Useifs18.PNG|center| | [[File:Useifs18.PNG|frame|center|Mortality Display: J-Curve sub-option window]] | ||
The J-Curve (see below) refers to the shape that a graph of mortality by age has when age is display on the X-axis (click on the Graph button at the bottom of the form to see this; click Clear at the bottom of the graph or Continue from its menu to return to the form itself). The form allows the user to view the age-specific distribution of types of mortality across various dimensions, which include mortality cause, geography, gender, year, and scenario. When you touch the Graph or Table button at the bottom, the form combines the specifications in each of its list boxes to produce the display. If you wish to display more than one item from a list box, hold down the control key and select additional ones. | The J-Curve (see below) refers to the shape that a graph of mortality by age has when age is display on the X-axis (click on the Graph button at the bottom of the form to see this; click Clear at the bottom of the graph or Continue from its menu to return to the form itself). The form allows the user to view the age-specific distribution of types of mortality across various dimensions, which include mortality cause, geography, gender, year, and scenario. When you touch the Graph or Table button at the bottom, the form combines the specifications in each of its list boxes to produce the display. If you wish to display more than one item from a list box, hold down the control key and select additional ones. | ||
[[File:Useifs19.PNG|center| | [[File:Useifs19.PNG|frame|center|J-Curve Graph Example]] | ||
The Mortality Display: J-Curve form has a set of menu options at the top. The Continue option allows the user to return to the previous screen. [[Repeated_Features#Country/Region,_Group_or_Geography-List|Grouping Options]] allows the user to select the unit of country/region, group, decomposed group or g-list. | The Mortality Display: J-Curve form has a set of menu options at the top. The Continue option allows the user to return to the previous screen. [[Repeated_Features#Country/Region,_Group_or_Geography-List|Grouping Options]] allows the user to select the unit of country/region, group, decomposed group or g-list. | ||
| Line 39: | Line 39: | ||
The form allows all of these values to be shown not just in total, but by cause of mortality or morbidity (such as cardio-vascular disease or malaria). | The form allows all of these values to be shown not just in total, but by cause of mortality or morbidity (such as cardio-vascular disease or malaria). | ||
[[File:Useifs20.PNG|center| | [[File:Useifs20.PNG|frame|center|Mortality and Disability Option Window]] | ||
The basic use of this form is similar to that of other features in the IFs program. Select one item from each of the boxes on the form and use the Graph or Table buttons at the bottom to obtain the display. On the form's menu, the sub-options under Grouping Options allow changing of the geography of displays from Countries/Regions to Groups, Decomposed Groups (showing all of the members of a group) or G-Lists (a large set of specialized geographical lists that can mix countries with groups of countries). | The basic use of this form is similar to that of other features in the IFs program. Select one item from each of the boxes on the form and use the Graph or Table buttons at the bottom to obtain the display. On the form's menu, the sub-options under Grouping Options allow changing of the geography of displays from Countries/Regions to Groups, Decomposed Groups (showing all of the members of a group) or G-Lists (a large set of specialized geographical lists that can mix countries with groups of countries). | ||
Latest revision as of 19:08, 27 July 2017
Mortality by Age, Sex, and Cause
Mortality by Age, Sex, and Cause is located as a sub option of Specialized Displays for Issues, which is in turn located under the Display option on the main IFs page. The Mortality by Age, Sex, and Cause option is also found in the Main Menu Map Pop-up options, a pop-up box shown after a click on a country from the map on the Main Menu window.
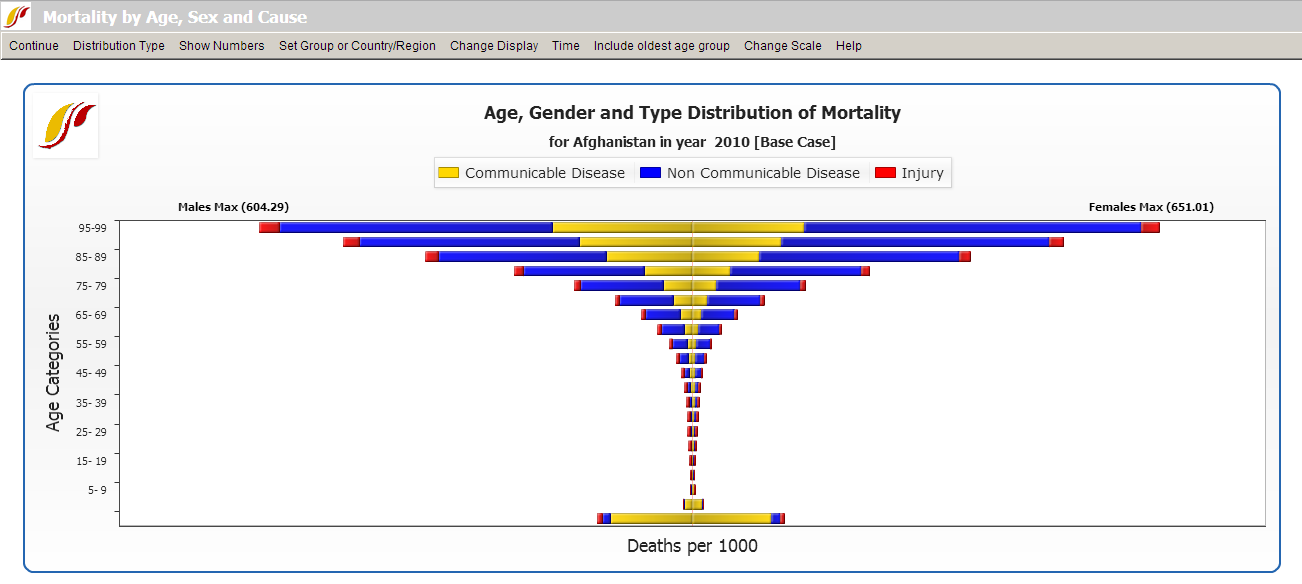
The Mortality by Age, Sex, and Cause option shows the distribution by age and sex of deaths per 1000 people. From this display form, users can choose to look at the forecasted results of mortality for any countries or groups in the IFs model.
The default country for viewing is Afghanistan unless you have previously clicked on a country from the map of the Main Menu Window (doing so makes the country selected the default for subsequent use of specialized displays ). You can change the country displayed by clicking the Change Display option on the form's menu. Under Change Display are sub-options that allow users to change the year or, the country/region that is being shown. If you would like to change to displaying groups, simply click the Set Group or Country/Region option located on this specialized display's menu.
On the default display mortality is shown in three general groupings: communicable disease, non-communicable disease, and injuries or accidents, with males on the left and females on the right. The sub-options under Distribution Type allow you to change that display. Communicable Disease, Non Communicable Disease, and Injuries sub-options put the males and females on the same side of the graphic to allow easier comparison. Communicable Disease Subtypes, Non Communicable Disease Subtypes, Injuries Subtypes sub-options show more detail of mortality causes in each of those categories. The Distribution Type option also has a sub-option to Compare Countries. This allows users to display four Distributions of Mortality graphs, each with a unique country and/or year selected. Users can see how the distribution of one country is forecasted to change across time, or how one country compares to another.
Click on the Show Numbers option and select the sub-option also titled Show Numbers to display a tabulated version of the inverted pyramid display. Under the Show Numbers/Show Factors sub-option are two sub-sub options. The first, Scaling Factors are deep level information not typically of interest to most users; they are the values by which we divided our initial mortality calculations in order to match those from the World Health Organization (WHO) in the first year. The second, Normalization Factors adjusts the detailed mortality data that we have obtained from WHO (courtesy of Colin Mathers) to the total mortality values that come from the United Nations Population Division data that we use for demographics across the model.
Another option on the menu of this form is Include oldest age group. The oldest age group, typically 100+ in IFs, has an extremely high mortality rate and, if shown in the graphical displays, would make mortality patterns for younger age categories difficult to distinguish. Hence the default option is to not show that age group, but this option allows its display.
Mortality Display: J-Curve
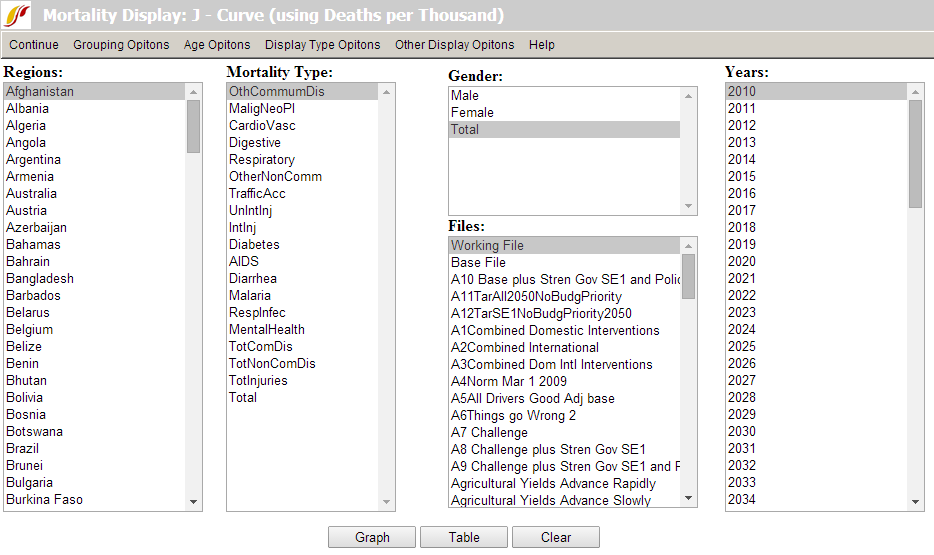
The Mortality Display: J-Curve sub-option is located under the Specialized Displays for Issues option, located in turn under Display from the main IFs screen.
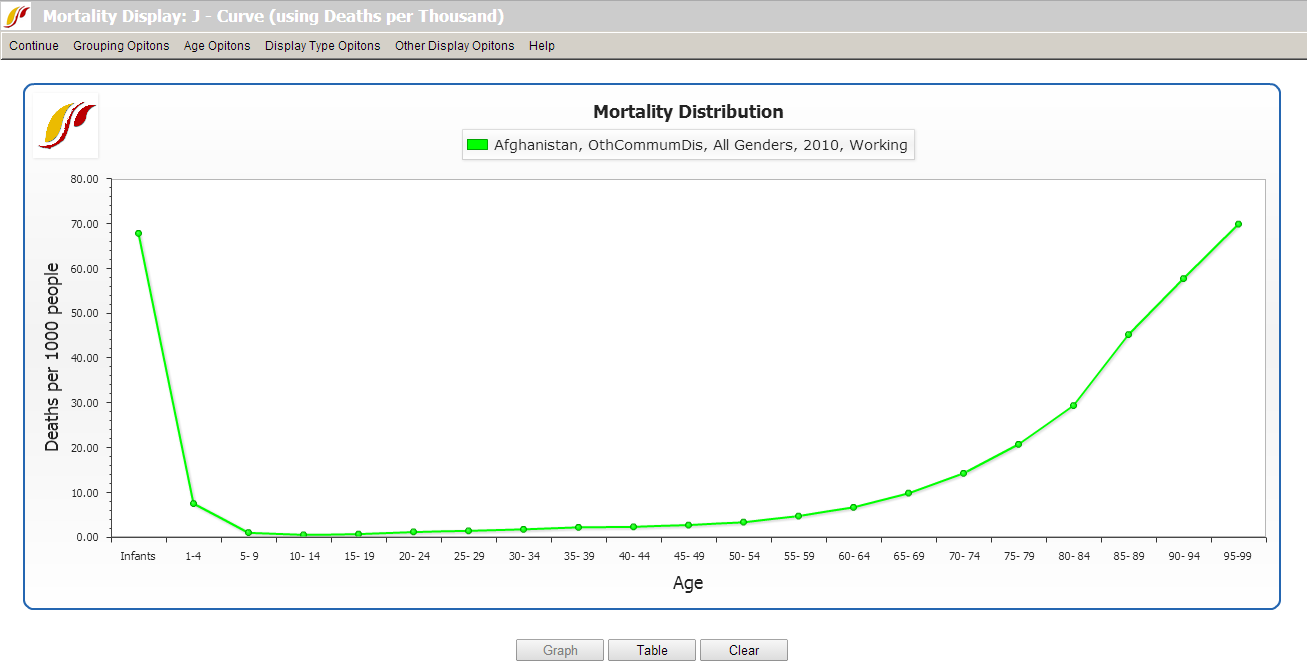
The J-Curve (see below) refers to the shape that a graph of mortality by age has when age is display on the X-axis (click on the Graph button at the bottom of the form to see this; click Clear at the bottom of the graph or Continue from its menu to return to the form itself). The form allows the user to view the age-specific distribution of types of mortality across various dimensions, which include mortality cause, geography, gender, year, and scenario. When you touch the Graph or Table button at the bottom, the form combines the specifications in each of its list boxes to produce the display. If you wish to display more than one item from a list box, hold down the control key and select additional ones.
The Mortality Display: J-Curve form has a set of menu options at the top. The Continue option allows the user to return to the previous screen. Grouping Options allows the user to select the unit of country/region, group, decomposed group or g-list.
Age Options allow the user to include people aged over 100 years and/or infants, or to display only adults (considered as aged 25 to 100 years old). The last sub-option uses the more collapsed age categories of the Global Burden of Disease (GBD) project rather than the 5-year categories of IFs.
Display Type Options allow the user to focus the display on children or adults and also to change the definitional range of the adult category. It also allows display of either mortality probability or mortality rate. The mortality rate is the more common measure and is simply the deaths divided by population, expressed as deaths per thousand. The probability rate is the likelihood of a person of a given age, say 15-year olds, dying before an older age, say 65. Although probabilities are normally expressed on a scale from 0 to 1 or 0 to 100, it is also possible to scale them from 0 to 1000 as in this display.
Other Display Options allow the user to toggle between displaying deaths in real numbers as deaths in thousands, or as a ratio of deaths per thousand people.
Mortality and Disability Years
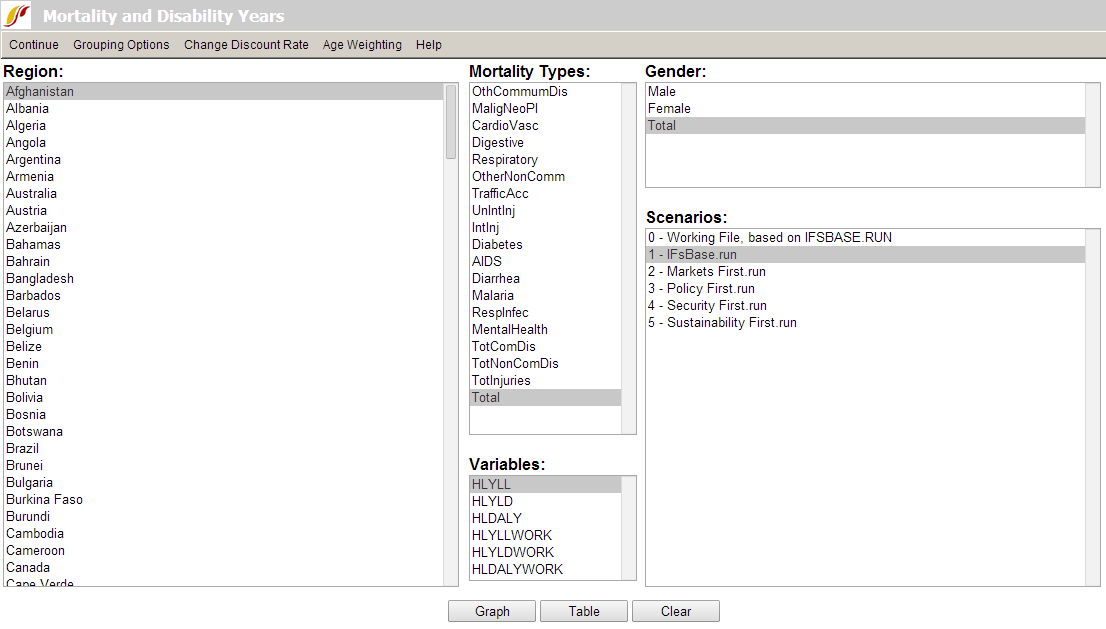
Mortality and Disability Years is a form accessed from a sub-option of the Specialized Displays for Issues sub-option of the Display Option on the Main Menu. This feature allows the user to display tables or graphs of key model forecast variables related to mortality and disability. Specifically, the user can see years of life lost (YLL; variable name HLYLL in IFs) as a result of age-specific mortality (the years of potential life lost from the death of a child are much more than those from the death of an adult). A subcategory of these years is years of working life lost (YLLWORK). Similarly, the form allows display of years of living with a disability (YLD) for the entire population or for those of working age (YLDWORK). The sum of Years of Life Lost (YLL) and Years Living with Disability (YLD) is defined to be Disability Adjusted Life Years (DALY) for the entire population and DALYWORK for those of working age.
The form allows all of these values to be shown not just in total, but by cause of mortality or morbidity (such as cardio-vascular disease or malaria).
The basic use of this form is similar to that of other features in the IFs program. Select one item from each of the boxes on the form and use the Graph or Table buttons at the bottom to obtain the display. On the form's menu, the sub-options under Grouping Options allow changing of the geography of displays from Countries/Regions to Groups, Decomposed Groups (showing all of the members of a group) or G-Lists (a large set of specialized geographical lists that can mix countries with groups of countries).
The Change Discount Rate menu option will be less familiar to most users. In financial analysis, a discount rate is often used to calculate the time value of money. Because money invested has a prospective return, the value of having it now is greater than the value of having it in future years. If that prospective return were 4% per year, the diminished worth of future money is estimated by "discounting" the money by a percentage for every year into the future. For instance, with a discount rate of 4%, $100 at year 1 is worth $100. At year 2, however, that $100 is worth $96; at year 3, $92.16; at year 4, $88.47, and so on.
In the health field it is similarly common to weight future years of life less heavily than the current one. A common discount rate is 3 percent and that is built in the displays generated from the form as a default. To change it, including the option of setting it to 0 and thereby turning off discounting, use the Discount Rate option under Change Discount Rate.
Discounting future years of life is a somewhat controversial concept in the computation of years of life lost. Perhaps an even more controversial one is age-weighting (the Global Burden of Disease uses both, so we include them in IFs along the ability to turn off either or both). Age weighting refers to the practice of assigning more value to certain years of life based upon its social role. For instance, one might consider working years more socially valuable than retirement years or those of childhood. Under the Age Weighting option the Beta parameter allows control over the age weighting but only a very rare user of IFs would want to exercise that control. For more information on discounting and age weighting formulations in IFs see the specialized document of the project on the health model.
Input the value you would like to use in the screen you are re-directed to and select Save. If you change the discount rate after having selected a graphic or table, that graphic or table will repaint to reflect the change.


