India's Economic Data
GDP2011
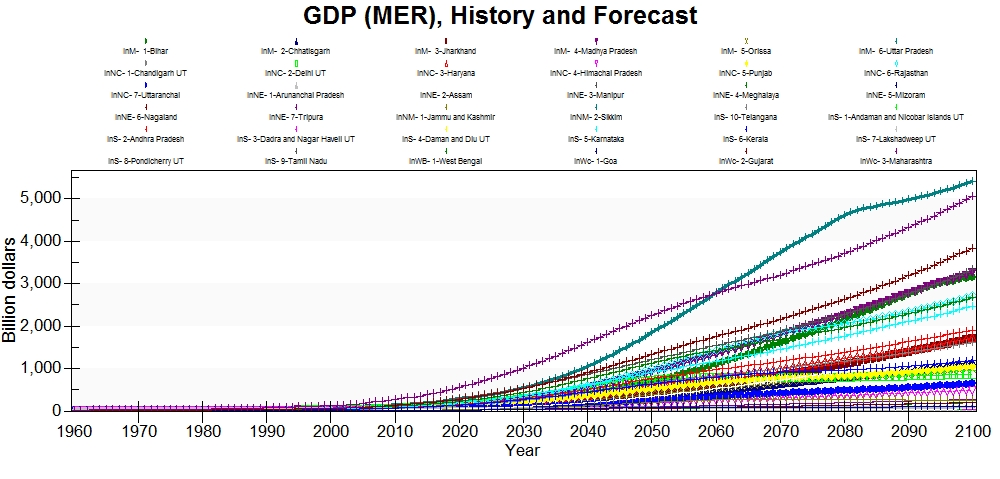
This series was estimated using data that was found on the Data.gov website for India's data. The original state level GDP data is in a 2004-2005 base year and was in ten million rupees (crore). There is not GDP data for union territories available. The 2004-2005 base year data was rebased using a deflator from WDI for India, which was applied to all states and the national data for all of India. The rebased national data was used to estimate the union territory GDP by using the proportion of each territory's population relative to the national population for each year. The population weighted GDP is the best GDP estimates that have been generated thus far. Telangana and Andhra Pradesh's GDP was estimated using a population weight. The data is normalized using ApplyMultAll.
Historically, Maharashtra has the highest GDP and this trend continues until nearly 2060. By 2060, Uttar Pradesh is forecast to surpass Maharashtra and have the highest GDP among the states and territories in India. Gujarat has the third highest GDP in the forecast.
There was a series of subnational GDP in at 2011-2012 base year, but that data was not used for several reasons. First, the 2011-2012 data lacked data for all union territories, like the other series, and it lacked data for West Bengal. West Begal is a large state with a substantial proportion of national GDP and estimating the data would both complicated and likely inaccurate with the data available. Second, the methods used for estimating subnational GDP changed significantly between the 2004-2005 base year data and the 2011-2012 base year data. It is not only the base year that had changed between those years, and the data is fundamentally uncomparable. The goal in the updated GDP estimation methodologies was to include more informal economic activities and to account for capital more accurately. For instance, previous GDP estimates treated all vehicles as of equal value, which is an inaccurate measure of capital. However, the third problem with the 2011-2012 base year data is that inflation has not been tracked properly over time in India. Even the Central Bank of India has publicly admitted that their inflation rates are inaccurate. The reason for this inaccuracy is that the consumer price index and the industrial price index have been used interchangably to calculate rates of inflation in India, and historically the two indices were positively correlated. In recent years the consumer price index has risen significantly and the industrial price index has decreased, the two indices have converged. Thus, India reports more economic growth than what has actually been occuring and inflation is lower than it is in reality. Therefore, rebasing West Bengal's 2004-2005 data into 2011-2012 data and using the rest of the 2011-2012 base year data is impossible because the WDI deflators are not the same that are used by the Central Bank in India, but are likely more accurate. Thus, the current methods have been used.
There was a previous GDP2011 series that was used in the earliest iterations of this model. This series was simply population weighted national GDP for 2010. This gave a single year of data for model initialization and it was an estimation based upon the 186-model India data. This is no longer used because the data is ultimately not GDP and inaccurate. The current series, although estimated, is more accurate.
GDP2011PCPPP
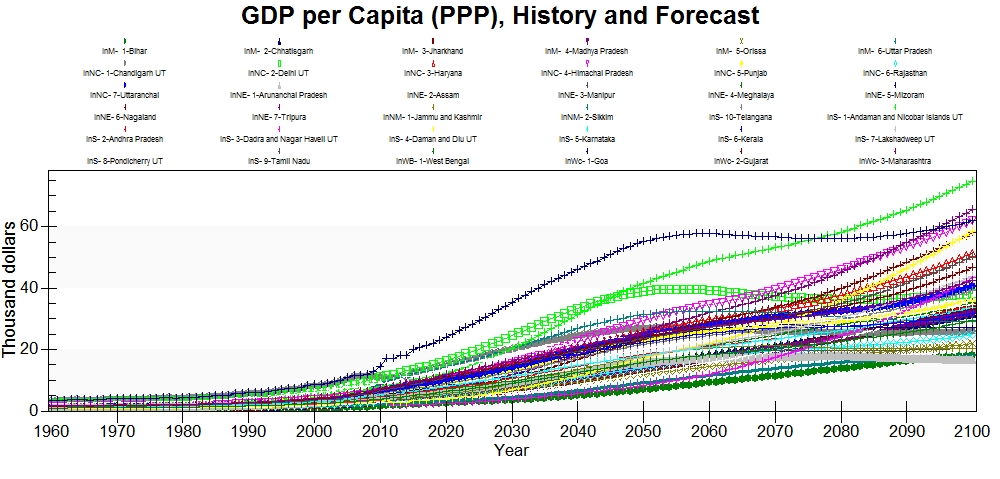
This series was estimated using the GDP2011 data and population data. This series is not in PPP, rather it is in 2011 rupees, thus ApplyMultAll is used to normalize the data to get the data into the GDP per capita at PPP.
Goa has the highest GDPPC historically and is forecast to continue to have the highest GDPPC until around 2075. Goa's GDPPC is forecast to plateau followed by a slight decline after 2050. Andaman and Nicobar Islands have the second highest GDPPC in the forecasts and will grow to having the largest after 2075, when it is forecast to surpass Goa. This forecast should be interpreted with great care, being the data for this tiny territory was crudely estimated. It would be best practice to avoid saying anything about the estimated territory’s GDP/GDPPC. Delhi has the third largest GDPPC historically, which also plateaus and then declines slightly as Goa does. Delhi is a union territory, but there is actual GDP/GDPPC data for the territory. Moreover, Delhi is highly urbanized and more productive, it makes sense that this territory would be towards the top. Bihar in contrast has the lowest GDPPC and from the other available data this seems to be logical and likely true into the future. Bihar appears to be one of the most impoverished states in India and among the most highly populated, production per capita is likely quite low.
GDPCurDol
GDP in current ten million (crore) rupees was found at the NITI Aayog website. The series runs from 2004-2014. ApplyMultAll is selected to normalize the data into US$.
GovtCurRev%GDP
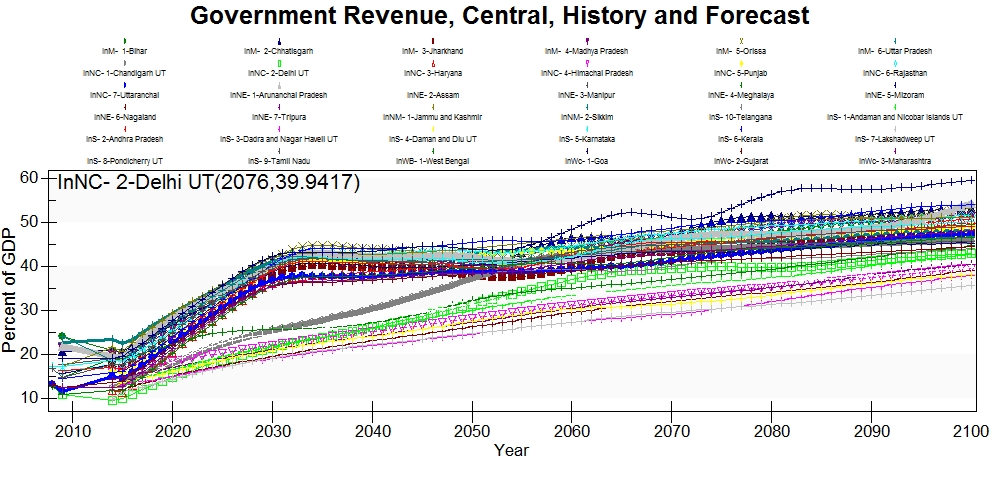
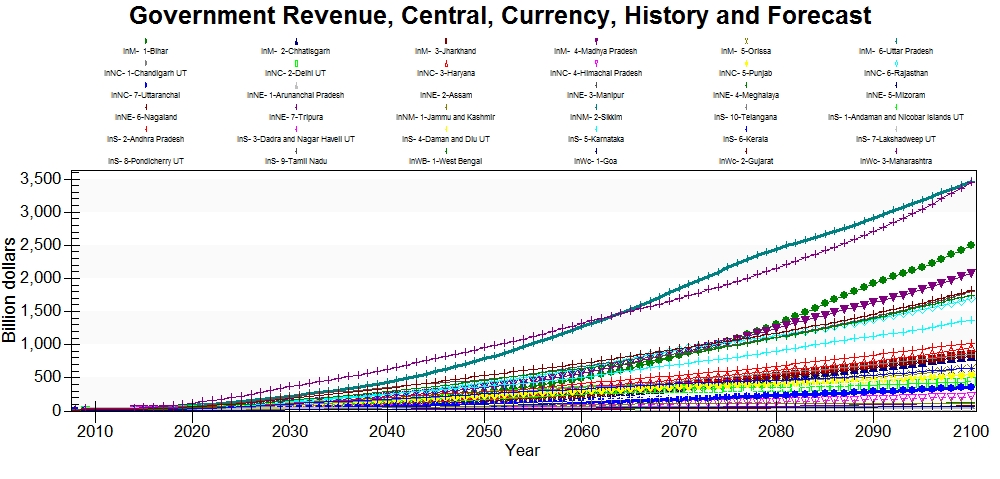
This data was found in the Report of the Comptroller and Auditor General of India on State Finances and was collected from all available recent state level reports. The series was estimated using Revenues minus Grants from the Central Government divided by GDP from the Time Series appendix, Part A. Telangana's data was not estimated and Andhra Pradesh's data includes Telangana because the data was produced before bifurcation.
Current revenues smoothly transition from historical data to forecasts. The current revenues as a percent of GDP increase rapidly in most states through the first 15 years of forecast. This suggests that the historical data is lower than was expected, which may have to do with how state finances are dealt with in India. There may be more federal revenues that subsidize the state revenues, but without further research it is unclear. Future users may want to research state and federal finances further in India before they make inferences about revenue and government finance forecasts.
GovtCalcExpendTot%GDP
This series was found in the Report of the Comptroller and Auditor General of India on State Finances in the appendix. It was calculated by using total expenditures relative to GDP from the same source.
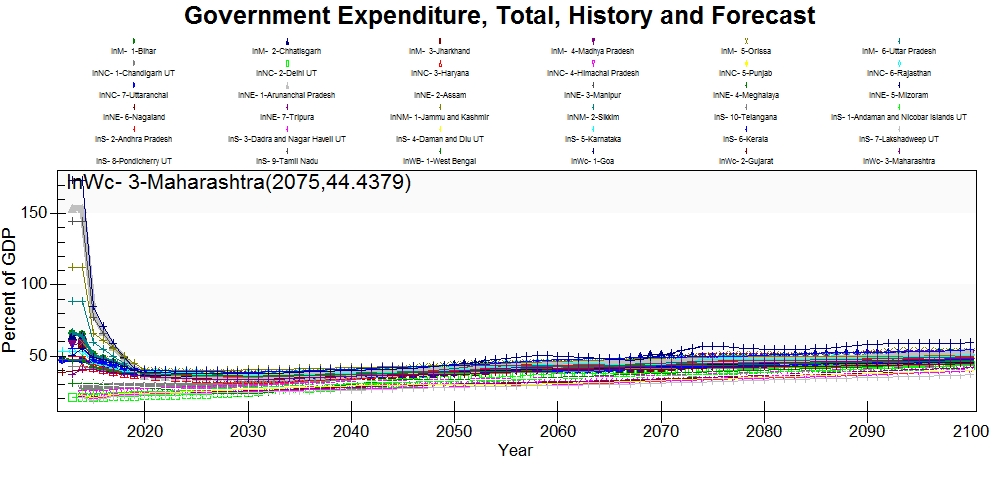
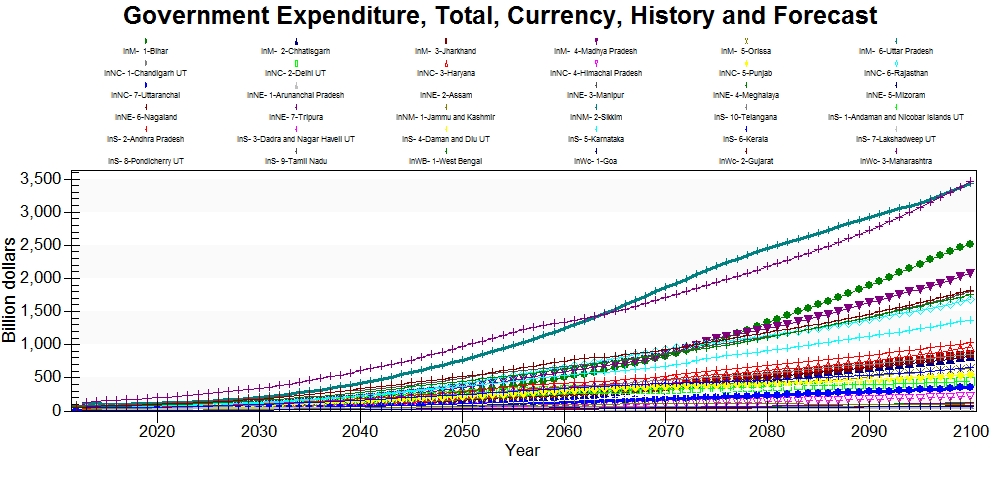
Government expenditure relative to GDP looks like there is a major problem with the historical data, but unfortunately this is not true. The historical data does not have a province that exceeds 48% of GDP in any year, and most are around 18%. This series is normalized using ApplyMultAll, which changes the historical data to normalize it to the national data. When the model has been broken out with this series not being normalized, the historical data is even more dramatically large. Some provinces have government expenditure as high as 200%. Despite the historical oddities, the forecasts look good.
GovtEdPub%GDP
This series was found in the Report of the Comptroller and Auditor General of India on State Finances in the appendix. Education spending was divided by GDP from the same source to estimate the state level education spending. The series runs from 2012-2014.
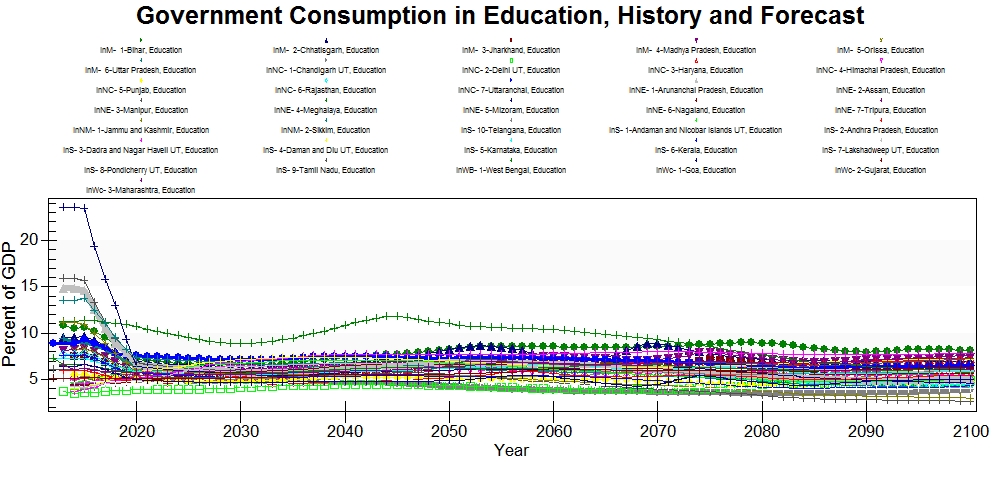
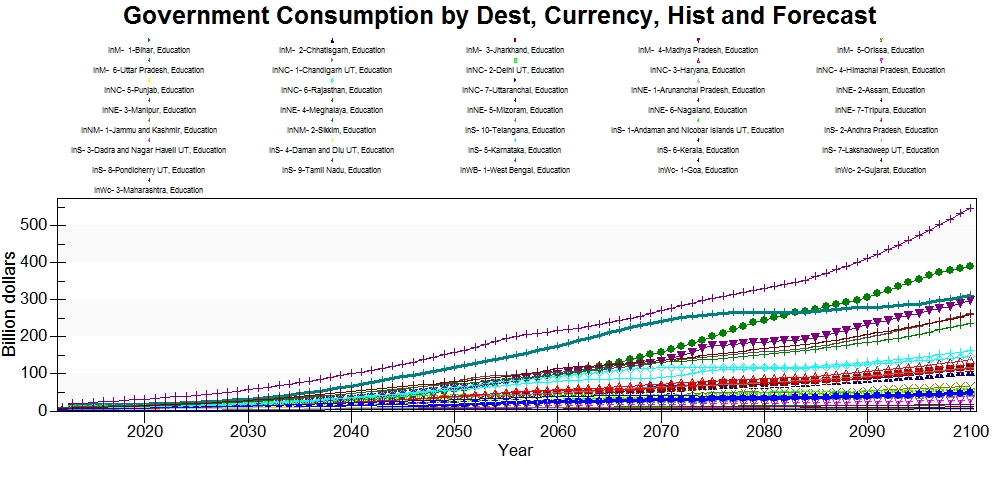
Like government expenditures the education consumption data is normalized using ApplyMultAll and shows higher historical values than what are in the actual data in the Access table. Without the data normalized, the historical values are shown to be even higher than they are shown in the above graphs. The largest historical data point is 9% of GDP, whereas what is shown in the historical data in IFs is nearly 30%. What is causing this jump in the historical data is unclear and future users may want to further investigate before they use this data for analysis. However, the forecasts are in line with the actual historical data and look reasonable.
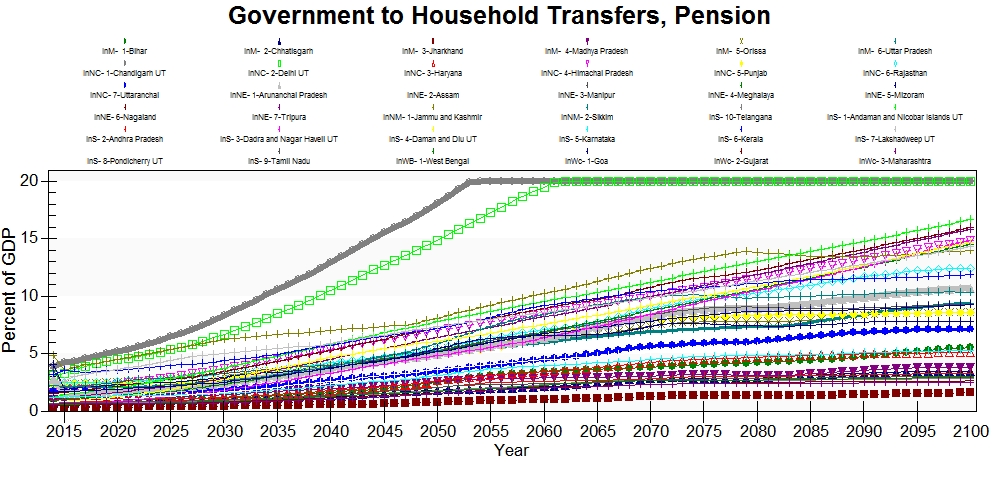
GovtPensions%GDP
This series was estimated using provident funds data from the State Finances Reports 2011-2014 relative to GDP in current rupees from NITI Aayog. This series is normalized using ApplyMultAll because provident funds are not exactly the same as pensions.
TaxGoodSer%CurRev
This series was estimated by using data from the Report of the Comptroller and Auditor General of India on State Finances. This series was estimated using taxes on sales and goods as a percentage of revenues minus grants from the Government of India relative to current revenues.
GovtDebt%GDP
This series was found at the NITI Aayog website from 2000-2015. Telangana was not estimated and Andhra Pradesh includes Telangana's debts and GDP.
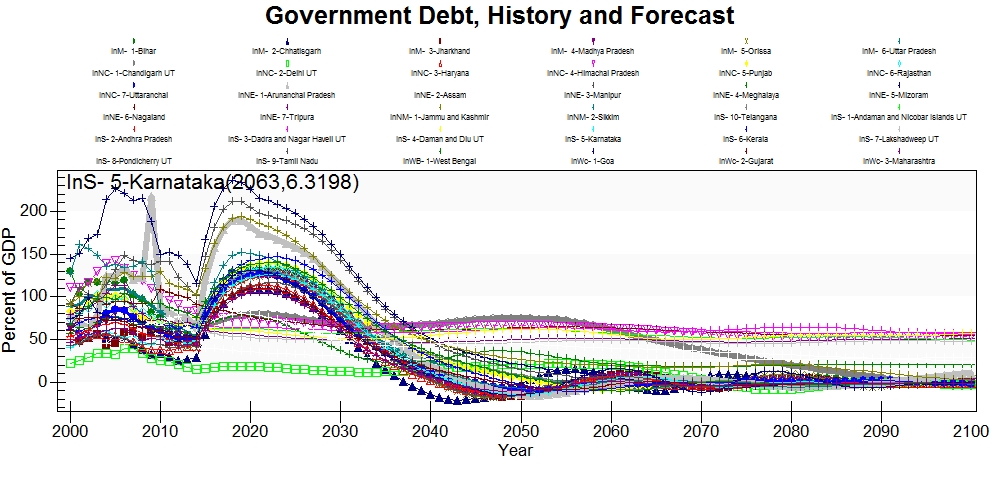
Government debt as a percent of GDP is normalized to national data using ApplyMultAll. The displayed historical data does not coincide with the actual data that is in the Access table, the debt as a percent of GDP for all states and territories in India is significantly lower than the displayed data suggests. The highest historical value is in 2009 in Mizoram at 109% of GDP, which is about half what the peak is in the graph. There is a decline in all debt to GDP ratios at the model's initialization year in 2014 followed by a rapid increase around 2025 in most states. This is followed by a rapid decline with debts falling below zero in many states around 2040. The model has smoother but much larger forecasts without the use of ApplyMultAll.
Xdebt
This series was estimated using data from the State Finances Reports 2011-2014 that were published by the Ministry of Finance of India and the Reserve Bank using total debt. This data is in Indian rupees and is normalized using ApplyMultAll. Telangana and Andhra Pradesh's debts were estimated using the 58/42 rule that was used to split the Andhra Pradesh's debts when Telangana became a state in 2014.
XDebtPPG%GDP
Public and publicly guaranteed debt relative to GDP was estimated using data from the State Finances Reports 2011-2014 that were published by the Ministry of Finance of India and the Reserve Bank. This was estimated using data from table 7.14 by summing SDLs, Power Bonds, Compensation and other bonds, NSSF, and WMA from RBI relative to GDP in current rupees from NITI Aayog. Telangana and Andhra Pradesh were estimated using the 58/42 rule, which is a rule that was used to split the government debt between the two states when they were bifurcated in 2014, where 58% of the debt was attributed to Andhra Pradesh and 42% to Telangana.
XDebtPNG%GDP
Private non-guaranteed debt relative to GDP was estimated using data from the State Finances Reports 2011-2014 that were published by the Ministry of Finance of India and the Reserve Bank. This was estimated using data from table 7.14 by using Loans from Banks and other FI to total GDP in current rupees from NITI Aayog. Telangana and Andhra Pradesh were estimated using the 58/42, which is the ratio that the national government used to split the debt between the two states when they were bifurcated in 2014.
XDebtPri%TotalXDEBT
This series was estimated using data from the State Finances Reports 2011-2014 using data in table 7.14. This was estimated using the sum of Loans from Banks and other FI to total debt. Telangana and Andhra Pradesh were estimated using the 58/42 rule, which is the rule that was used to split the government debt between the two states when they were bifurcated in 2014, where 58% of the debt was attributed to Andhra Pradesh and 42% to Telangana.
XReserves%GDP
India's subnational reserves were estimated using data from the State Finances Reports 2011-2014 using reserves and the GDP in current dollars from NITI Aayog. The reserve data in this series does not include gold reserves from the central bank, which is what this series is supposed to include, and because of this the series is normalized using ApplyMultAll to give an improved estimate of reserves. Telangana and Andhra Pradesh were estimated by the 58/42 split that was used to split the state's debt.
