Running the Model
Overview
This section of the Help Menu will further explain the options located under the Run sub-option located under the Scenario Analysis option on the Main Menu of IFs.
Users can change parameters in the Quick Scenario Analysis with Tree or load Scenario-Load-Files into IFs. These changes can then be turned into a Run-Result-Files. There are two different methods for creating these Run-Result-Files. It is possible to create one file using the Single Run function. It is also possible to create large numbers of Run-Result-Files in order to compare how they differently affect changes around one parameter or variable of specific interest to users. The second option is the Sensitivity Run function.
To learn more about this topic, please see below:
Single Run
This menu item can be found by selecting Scenario Analysis from the Main Menu followed by the Run sub-option.
Use this IFs option if you would like to take your Working File and convert it into a Run-Result-Files. If you have changed parameters in your scenario tree, or you have loaded a previously structured scenario, select the Single-Run option under Scenario Analysis on the Main Menu of IFs.
This is not the most common way for users to create Run-Result-Files. Typically, these files are created through the Quick Scenario Tree.
This feature of IFs is also used after Rebuilding the Base.
After you have selected this option you will be prompted by a screen where you can specify for how many years IFs should run. Choose the year you would like the run to stop and then click Start Run.
Sensitivity Run
This menu item can be found by selecting Scenario Analysis from the Main Menu followed by the Run sub-option.
Analysis with alternative parameters helps map the degree to which variations in parameters affect outcomes (forecasts of variables). Often you want a fairly systematic view of how parameter changes will affect outcomes. Such a mapping can identify points of policy leverage that will most productively produce desired futures or elements of risk that most jeopardize those same futures.
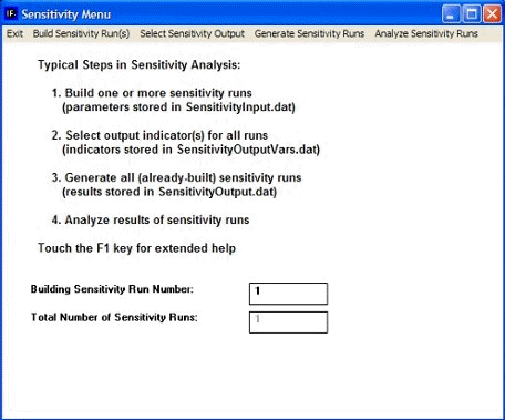
On the Main Menu of this feature, select Build Sensitivity Runs. From this menu you can access and accomplish the following:
Adding a single change to the set of sensitivity runs: This change is stored in a file called SensitivityInput.dat. The advantage of this option is that, after you select the parameter name and dimensionality, you have the option of customized or time-variant parameter specification.
Setting a change loop to the set of sensitivity runs: The change loop runs from a minimum to a maximum value for a selected parameter, depending on the step size or step number you specify. It has the advantage of allowing you to set up a series of runs (one for each step of the loop) with minimal difficulty. It has the disadvantage of allowing limited time-invariant parameter specification. Specifically, it is possible to select a period of years (the Shift Years) over which the stepped parameter changes will occur.
Select Sensitivity Output: From this menu you can access and accomplish the following:
Identify Output Variables: this feature allows you to identify and select on parameter that will be used as an output variable. Selecting this option will open a window that allows users to choose from variable used in IFs. From this screen, users can select variables by clicking on them. The user will then be prompted to select a country. The variables are also organized into categories and grouped into a box located in the bottom right corner. At the top of this menu, users are able to pull up a box explaining scenario output files by selecting that option from the Main Menu. Users are also able to, change variable selection options by clicking on that option on the Main Menu. The next option for users is to change historic variable options by selecting that menu option. Another option on this menu allows users to open up the IFs historic base. Yet another option on this menu allows users to search through the lists of variables by typing keywords.
- Display Output Variables: This option allows users to see specific parameters that users have selected for display.
- Clear Output Variables: This feature allows users to clear any variables that they have entered into the sensitivity menu.
Generate Sensitivity Runs: After you have selected various output parameters you would like to track, click on this option to see these runs actualized.
It is necessary to generate the sensitivity runs, which is a process that will use both the specification of sensitivity runs and the specification of output variables that you have created. This process actually involves iteration across three sub-processes: for each sensitivity run you have specified, the parameters you set are copied into the working file of the model; then the model is run, re-computing all variables; finally, the values for the variables you specified as output are copied into a new file named SensitivityOuput.dat. Each line of that file contains values for a single selected sub-variable from the initial year of the run to the final year. If prior to beginning the run you wish to change the final year from the default value, use the Horizon parameter on the Display menu (reached from the Main Menu).
Analyze Sensitivity Runs: This allows users to graphically display the various parameters they wanted to explore in more depth.
Analysis of the SensitivityOuput.dat file will generate insight into the relationship between parameter variation and variable values in forecasts. Normally statistical and/or graphical analysis will be involved. At this point, IFs does not include limited options for that analysis (thanks for those to Sergei Parinov).
