Spectrum
UNAIDS forecasts the incidence and prevalence of HIV AIDS to guide health policy decisions. UNAIDS has developed the Sectrum tool in collaboration with the Future's institute in order to record and present these forecasts. In the spectrum model, UNAIDS presents global, regional and country specific estimates to track the HIV epidemic. Some of the datasets that are avilable in the spectrum database are number of people who are currently living with HIV, people who have been newly infected with HIV , people who have died of AIDS in a particular year etc. The latest available model of spectrum is version 5.46 and can be accessed here- http://www.avenirhealth.org/software-spectrum.php.
Assumptions used in the spectrum model in development of AIDS forecasts
Two types of epidemics are considered when developing AIDS forecasts, "general epidemics" where HIV is firmly established in the general population of a region or nation and "concentrated epidemics" where the prevalence of HIV is concentrated in a particular sub-group of the population. Concentrated epidemics are generally considered to be low intensity epidemics.
In order to forecast the prevalence of HIV, pregnant women infected with HIV are used as a distal driver. Number of sexworkers, number of intravenous drug users are used as proximate drivers to forecast the spread of HIV prevalence. Data from countries with strong reporting systems when it comes to infection with HIV are also used to inform these estimates. In case of countries with concentrated epidemics epidemiological curves specific to the particular infected sub-group are used to arrive at more accurate forecasts. In addition to this, spectrum also uses data such as number of people in the population with access to ARTs and ARVs (Anti-retroviral therapy and vaccines) to determine the rise or fall in prevalence and incidence of HIV.
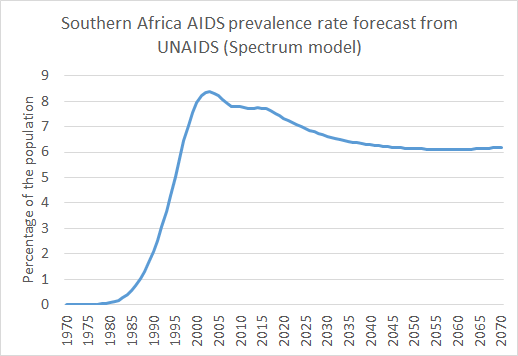
Spectrum allows the user to create projections for specific countries and regions. However, AIDS forecasts are not available for the world as a whole. The demographic data in Spectrum is from the world population prospects (WPPs) reports. The graph below shows the forecasts from Spectrum for AIDS prevalence for the southern African region from 2016 to 2070.
IFs and Spectrum
The forecasts of HIV prevalence and death rates in IFs are based on the forecasts from Spectrum. When developing AIDS prevalence forecasts, IFs makes use of "peak years" i.e. the year in which the HIV prevalence is expected to peak in a particular region and a control rate, i.e. the rate at which the spread of the disease will be controlled post the peak year. In case the peak year has already passed, IFs makes use of the GDP per capita to determine the rate at which prevalence will fall. The peak years are selected on the basis of the spectrum forecasts of AIDS prevalence. The control rate is determined on the basis of the historical growth rate of prevalence in the region. The forecasts in IFs are in line with the forecasts from Spectrum.
Series pulled for IFs
As mentioned above, we pull output from spectrum to create SeriesHIVPeaks, which contains data for both the year at which the prevalence of HIV will peak in a country, and the prevalence rate in that year.
Instructions on pulling data from Spectrum and creating HIVPeaks data
The spectrum model is a dynamic model that is updated every year. It is therefore recommended that the user initially check for the latest version of the model. The latest version of spectrum is available here- http://www.avenirhealth.org/software-spectrum.php.
Extracting data from spectrum
Spectrum allows the user to create projections for various countries and regions. The user can create multiple projections at once for all countries involved in the 'Tools' tab of the software. It is important to note that the user must only select relevant datasets i.e. prevalence and deaths data. Creating multiple projections for all available datasets will crash the system. Once multiple projections have been created, the user can extract relevant data from these projections using the 'extract' function in the Tools tab. This data can be extracted to an excel file.
Creating peakyear file
Once this data has been extracted, the user should use the MAX function in excel to arrive at the highest rate of prevalence in a country. Then using the HLOOKUP function the user should calculate the peak years, i.e. the year in which the epidemic peaks in a particular country. This max prevalence and peakyear data should then be updated in the peakyear access table "SeriesHIVPeaks" and should then be passed to the vetter for vetting. On updation of the tables in IFs, it would be prudent of the user to compare forecasts of AIDS prevalance for sample countries in IFs to those in Spectrum to identify variances and understand their reasoning.
