UNSD Environmental Indicators
Summary
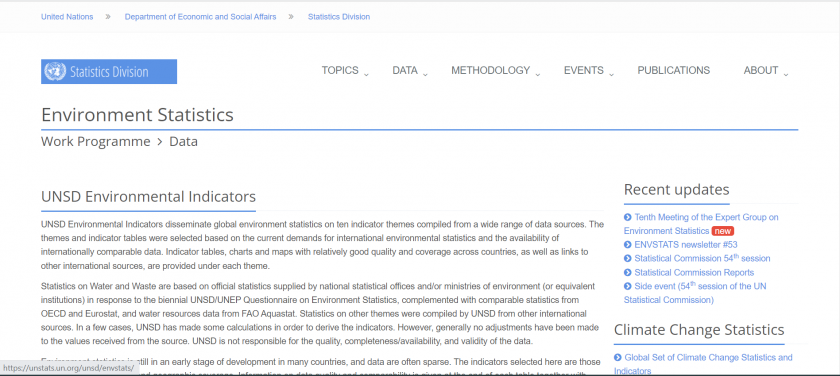
UNSD Environmental Indicators disseminate global environment statistics on ten indicator themes compiled from a wide range of data sources. The themes and indicator tables were selected based on the current demands for international environmental statistics and the availability of internationally comparable data. Indicator tables, charts and maps with relatively good quality and coverage across countries, as well as links to other international sources, are provided under each theme.
Environment statistics is still in an early stage of development in many countries, and data are often sparse. The indicators selected here are those of relatively good quality and geographic coverage. Information on data quality and comparability is given at the end of each table together with other important metadata.
IFs uses UNSD Environmental Indicators to pull data related to wastewater and how populations are connected to wastewater, such as SeriesWasteWaterTreat%, SeriesWasteWaterSecTreat%, and SeriesWasteWaterCollect%.
Pulling Instructions
Step 1) Navigate to the UNSD Environmental Indicators homepage.
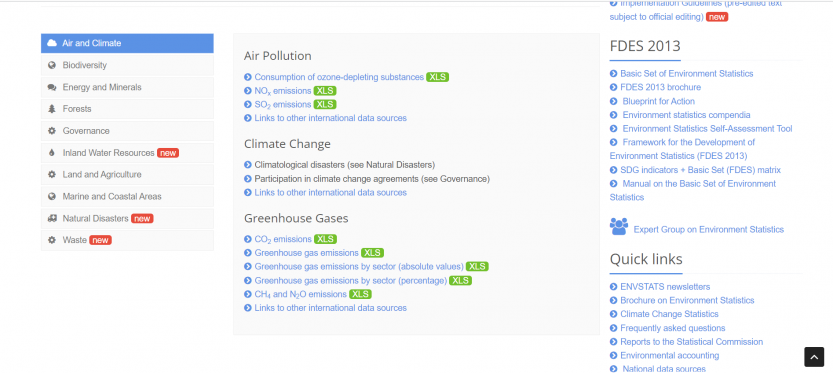
Step 2) Scroll down to see the different themes that the UNSD has data series on. Themes are listed on the left and the datasets under that theme appear in the center.
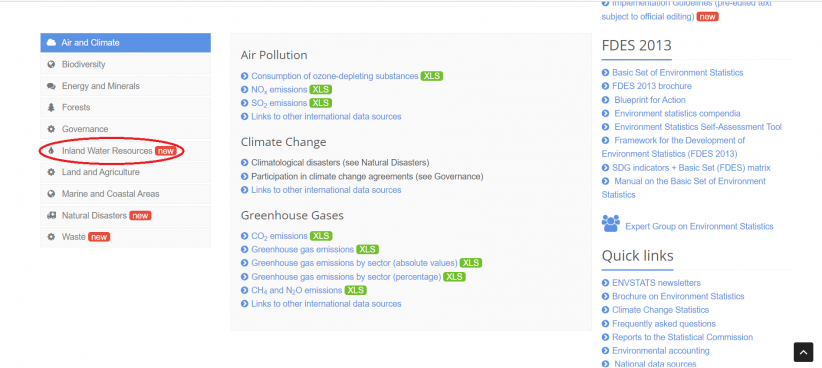
Step 3) Most data for IFs will be under "Inland Water Resources". Select that option and a new list of data will load.
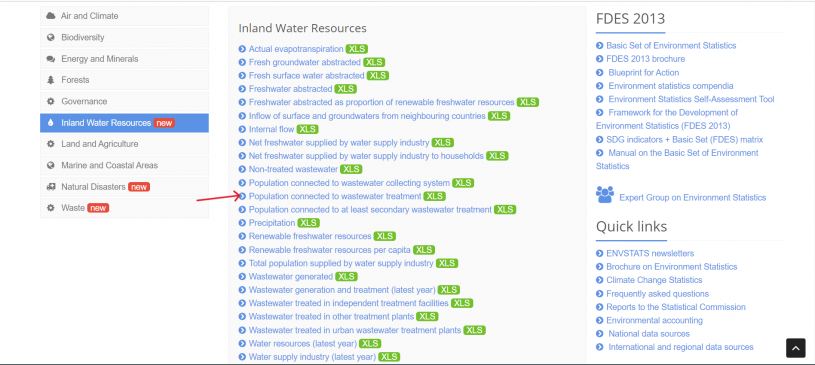
Step 4) Click directly on the desired series. This example will use "Population connected to wastewater treatment".
Step 5) An Excel file will immediately download. Now you can format the data to upload it into IFs. To import data into IFs, please follow the instructions found in the Importing Data (general instructions) page.


