Use IFs (Download): Infrastructure
Information on the data and equations used in the Infrastructure displays can be found in the wiki page on the Infrastructure sub-module.
The Infrastructure Profile specialized display can be found from the Main Menu by hovering over the display option, then over the Specialized Display for Issues sub-option, and clicking on the Infrastructure Profile sub-sub-option.
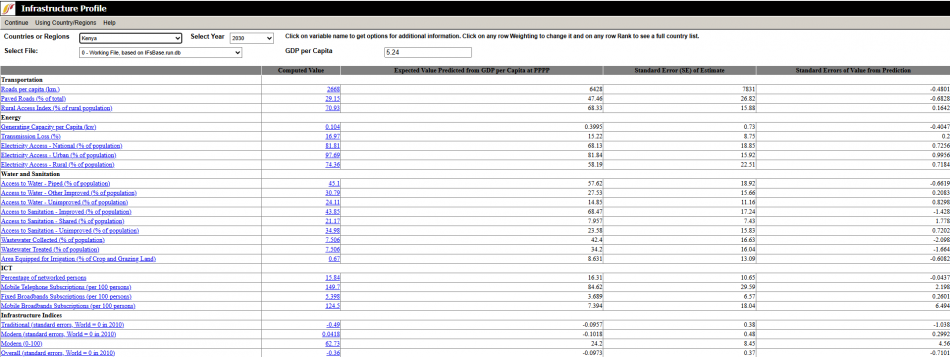
The Infrastructure Profile page shows the computed value for a number of infrastructure related variables for a specific year, country or region, and scenario. It also shows the expected value based upon the selected country or regions GDP per capita at PPP which is shown near the top of the screen. This expected value is calculated from a regression function (line of best fit) of GDP per capita at PPP and the selected variable for all countries. This page also displays the standard error of the regression function (Estimate) and the standard error of the specific computed value (Value from Prediction).
There are several options and features on this page:
- Continue: Go back to the previous menu or to the Main Menu of IFs.
- Using Groups or Using Countries/Regions: Click Switch to change between displaying groups or countries and regions. If groups are currently selected then Using Groups will be displayed on the tool bar and vice versa.
- Help: Open the corresponding page in the Pardee Wiki with the current feature or display they are using.
Display Option Fields:
- Groups or Countries or Regions: Choose the desired country or region, or group form the drop down.
- Select Year: Choose the desired year to display form the drop down.
- Select File: Choose the desired saved scenario to display from the drop down.
Click on one of the computed values to open a table of that variable forecasted through 2050 for all the scenarios loaded onto the current version of IFs. Click on the variable name to open a graph that displays the current GDP per capital and the computed value for the selected variable and country or group; and a line graph of the expected value of the variable for varying levels of GDP per capita.
