Version 7.83 (March 25th, 2022)
PREVIOUS VERSION | INDEX PAGE | NEXT VERSION
You can download IFs Version 7.83 at 7.83 VB6 version, 7.83 NET version, and 7.83 Uganda 135 version.
Interface Updates
- Detailed Formula grid allows columns to change width, adding definitions to detail in historical formulas.
- New default format for line graphs defined by Dave
- Fix for Aliases, they were messed up since we standardized Region/Country names.
- Fix Updating aliases when renaming region, new orders would mess up the table.
- Fix Problem with Bar Charts, first bar was wrong:
Model Updates
- Switching to using HHINCDISPERM saved in common, plus some comments
- Fixed using GDS before it was computed to calculate DEPENDENCE (bilateral mode).
- Removed AIDGDPR no longer used
- MALNPOPP, CLPC, CLPCCV, CLPCMDER update, trying to use same year, and 3 to estimate the other in preprocessor (Agriculture).
- Added AGEOFMARRIAGE initial forecast, both for Males and Females (latter shown below):
Data Updates
- A LOT OF preprocessors series from FAO food balance sheet
- Four MalnPop related series
- Five Age of Marriage tables
- Six migration tables sent by Caleb.
- There is also an update on Bilateral Data.
- On the migration tables:
- Overall, the updated migrant stock doesn't change the behavior much versus the ones that you provided here. Though, it does address some oddities, like in the Maldives migration forecast, that showed up there. In short, your update addressed many of the issues and the stock update addressed the few new ones introduced. There are only minor changes seen in World GDP and Population. Some individual countries do however see notable changes and the remittance data update introduces additional changes for some.
All Updates Base: Migrants in, Millions; To 2040
Packaged Base: Migrants in, Millions; To 2040
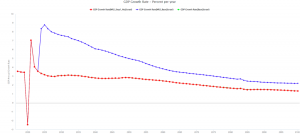
Looking at the early years, many of the spikes and early humps are removed. Similar changes are seen in migrants out. Israel is the green line that is "missing" in the newly updated data. This leads to much better-behaved GDP growth rates (shown below) and a more stable GDP per capita trend.
Israel Run Comparison: GDP Growth Rate, Percent; Red/Green - Updated Migration Data Runs, Blue - Packaged Base
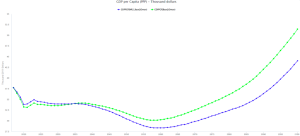
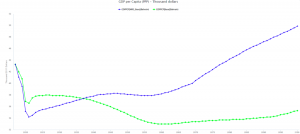
There could potentially be concerns with the Gulf States. The first graph shows GDPPC for Bahrain in the Packaged Base (Blue) and the All Updates (Green) runs. The initial decline is less swift, but it declines more over the long term and stays lower for all years after ~2035. A similar but opposite and subdued effect is seen for Oman in the second graph. The third graph shows the percent difference in-year for all of the GCC members. Oman and Bahrain see the most extreme movements in either direction.
Oman GDPPC Comparison: Green - Updated Data; Blue - Packaged Base Case
Bahrain GDPPC Comparison: Green - Updated Data; Blue - Packaged Base Case


