China Sub-Regional June 2017 Consolidation: Difference between revisions
AltheaDitter (talk | contribs) No edit summary |
AltheaDitter (talk | contribs) No edit summary |
||
| Line 68: | Line 68: | ||
|} | |} | ||
= Population = | |||
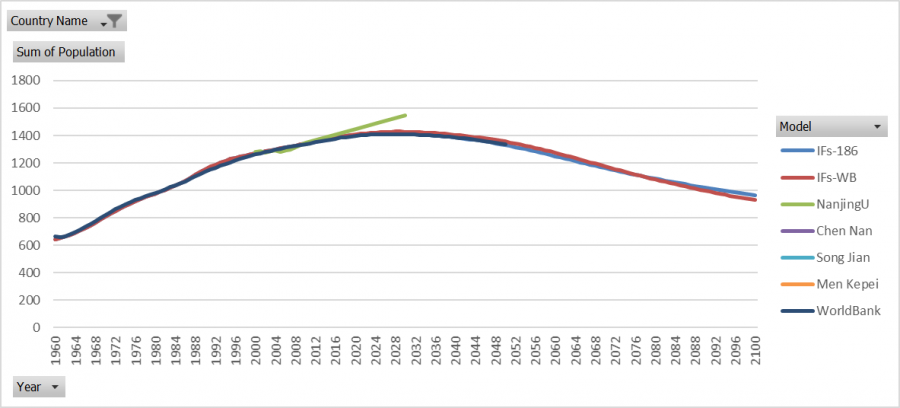
The provincial model's population for China was rolled up in IFs and compared to other population forecasts for China, as shown below. It is clear that the population forecast from the sum of the provinces (IFs_WB) is in line with other forecasting models. Nanjing University's forecasting model is the most off from the rest of the forecasts, where population growth is forecast to continue to rise. | |||
[[File:ChinaPopVet 728.png|900px|ChinaPopVet 728.png]] | [[File:ChinaPopVet 728.png|900px|ChinaPopVet 728.png]] | ||
Revision as of 17:54, 1 June 2017
Overview
China's sub-regional model has a total of 63 preprocessor series. Although there are 652 preprocessor series in the IFs model, there are many that are not applicable to sub-regional models or do not significantly impact forecasts; only 355 preprocessor series are sought for sub-regionalization. Thus China's sub-regional model has nearly 18% coverage at this point. There are a 29 preprocessor series that have been identified that could be pulled into the model. If this data was to be pulled the the total coverage of the model would increase to nearly 26%.
Below is a table that shows the module coverage for the China sub-regional model. Population has the most coverage, but this is also the fewest number of preprocessor series. The economy module has the second highest coverage, which is good. Population and Economy have the greatest impact on the model's overall behavior and coverage in these modules is important. Health and education are areas of weakness for the China sub-regional model. In part the weakness is driven by the large number of series in those modules. There is more education data available that could be brought into the model, but some of the data requires historical age-sex cohorts to calculate rates with the data. Health has low coverage because there is not a lot of health data that is available for free and in English. It appears that much of China's health data is proprietary and not publicly available, but there may be alternative sources available if a researcher searched in Mandarin.
| IFs Module | Preprocessor Series Pulled | Total Preprocessor Series | Module Coverage |
|---|---|---|---|
| Population | 7 | 8 | 87.5% |
| Economy | 24 | 55 | 43.6% |
| Health | 5 | 57 | 8.8% |
| Education | 8 | 91 | 8.8% |
| Agriculture | 11 | 36 | 30.6% |
| Energy | 7 | 66 | 10.6% |
| Infrastructure | 1 | 21 | 4.8% |
| Environment | 0 | 9 | 0.0% |
| Socio-Political |
0 | 12 | 0.0% |
| Total | 63 | 355 | 17.7% |
| Potential Series | 92 | 355 | 25.9% |
Population
The provincial model's population for China was rolled up in IFs and compared to other population forecasts for China, as shown below. It is clear that the population forecast from the sum of the provinces (IFs_WB) is in line with other forecasting models. Nanjing University's forecasting model is the most off from the rest of the forecasts, where population growth is forecast to continue to rise.
